A list of journal articles published on behalf of the WBEA featuring data collected from WBEA environmental monitoring programs. WBEA publications are listed below in reverse chronological order, and include an abstract, key terms, a list of contributing authors, and links to view and download each publication.
Publications
Impacts of a large boreal wildfire on ground level atmospheric concentrations of PAHs, VOCs and ozone
During May 2016 a very large boreal wildfire burned throughout the Athabasca Oil Sands Region (AOSR) in central Canada, and in close proximity to an extensive air quality monitoring network. This study examines speciated 24-h integrated polycyclic aromatic hydrocarbon (PAH) and volatile organic compound (VOC) measurements collected every sixth day at four and seven sites, respectively, from May to August 2016. The sum of PAHs (ΣPAH) was on average 17 times higher in fire-influenced samples (852 ng m−3, n = 8), relative to non-fire influenced samples (50 ng m−3, n = 64). Diagnostic PAH ratios in fire-influenced samples were indicative of a biomass burning source, whereas ratios in June to August samples showed additional influence from petrogenic and fossil fuel combustion. The average increase in the sum of VOCs (ΣVOC) was minor by comparison: 63 ppbv for fire-influenced samples (n = 16) versus 46 ppbv for non-fire samples (n = 90). The samples collected on August 16th and 22nd had large ΣVOC concentrations at all sites (average of 123 ppbv) that were unrelated to wildfire emissions, and composed primarily of acetaldehyde and methanol suggesting a photochemically aged air mass. Normalized excess enhancement ratios (ERs) were calculated for 20 VOCs and 23 PAHs for three fire influenced samples, and the former were generally consistent with previous observations. To our knowledge, this is the first study to report ER measurements for a number of VOCs and PAHs in fresh North American boreal wildfire plumes. During May the aged wildfire plume intercepted the cities of Edmonton (∼380 km south) or Lethbridge (∼790 km south) on four separate occasions. No enhancement in ground-level ozone (O3) was observed in these aged plumes despite an assumed increase in O3 precursors. In the AOSR, the only daily-averaged VOCs which approached or exceeded the hourly Alberta Ambient Air Quality Objectives (AAAQOs) were benzene (during the fire) and acetaldehyde (on August 16th and 22nd). Implications for local and regional air quality as well as suggestions for supplemental air monitoring during future boreal fires, are also discussed.
Keywords: Wildfire, PAH, VOC, Fort McMurray, Ozone, Air quality
The Impact of the 2016 Fort McMurray Horse River Wildfire on Ambient Air Pollution Levels in the Athabasca Oil Sands Region, Alberta, Canada
An unprecedented wildfire impacted the northern Alberta city of Fort McMurray in May 2016 causing a mandatory city wide evacuation and the loss of 2,400 homes and commercial structures. A two-hectare wildfire was discovered on May 1, grew to ~ 157,000 ha by May 5, and continued to burn an estimated ~ 590,000 ha by June 13. A comprehensive air monitoring network operated by the Wood Buffalo Environmental Association (WBEA) in and around Fort McMurray provided essential health-related real-time air quality data to firefighters during the emergency, and provided a rare opportunity to elucidate the impact of gaseous and particulate matter emissions on near-field communities and regional air pollution concentrations. The WBEA network recorded 188 fire-related exceedances of 1-hr and 24-hr Alberta Ambient Air Quality Objectives. Two air monitoring sites within Fort McMurray recorded mean/maximum 1-hr PM2.5 concentrations of 291/5229 μg m− 3 (AMS-6) and 293/3259 μg m− 3 (AMS-7) during fire impact periods. High correlations (r2 = 0.83–0.97) between biomass combustion related gases (carbon monoxide (CO), non-methane hydrocarbons (NMHC), total hydrocarbons (THC), total reduced sulfur (TRS), ammonia) and PM2.5 were observed at the sites. Filter-based 24-hr integrated PM2.5 samples collected every 6 days showed maximum concentrations of 267 μg m− 3 (AMS-6) and 394 μg m− 3 (AMS-7). Normalized excess emission ratios relative to CO were 149.87 ± 3.37 μg m− 3 ppm− 1 (PM2.5), 0.274 ± 0.002 ppm ppm− 1 (THC), 0.169 ± 0.001 ppm ppm− 1 (NMHC), 0.104 ± 0.001 ppm ppm− 1 (CH4), 0.694 ± 0.007 ppb ppm− 1 (TRS), 0.519 ± 0.040 ppb ppm− 1 (SO2), 0.412 ± 0.045 ppb ppm− 1 (NO), 1.968 ± 0.053 ppb ppm− 1 (NO2), and 2.337 ± 0.077 ppb ppm− 1 (NOX). A subset of PM2.5 filter samples was analyzed for trace elements, major ions, organic carbon, elemental carbon, and carbohydrates. Sample mass reconstruction and fire specific emission profiles are presented and discussed. Potential fire-related photometric ozone instrument positive interferences were observed and were positively correlated with NO and NMHC.
Keywords: Boreal wildfire, Biomass combustion, Normalized excess emission ratios, Particulate matter, Ozone, Total reduced sulfur
Source apportionment of ambient fine and coarse particulate matter at the Fort McKay community site, in the Athabasca Oil Sands Region, Alberta, Canada
A comprehensive filter-based particulate matter polycyclic aromatic hydrocarbon (PAH) source apportionment study was conducted at the Wood Buffalo Environmental Association Bertha Ganter-Fort McKay (BGFM) community monitoring station from 2014 to 2015 to quantify ambient concentrations and identify major sources. The BGFM station is located in close proximity to several surface oil sands production facilities and was previously found to be impacted by their air emissions. 24-hour integrated PM2.5 and PM10–2.5 samples were collected on a 1-in-3-day schedule yielding 108 complete organic/inorganic filter sets for source apportionment modeling. During the study period PM2.5 averaged 8.6 ± 11.8 μg m−3 (mean ± standard deviation), and PM10–2.5 averaged 8.5 ± 9.5 μg m−3. Wind regression analysis indicated that the oil sands production facilities were significant sources of PM2.5 mass and black carbon (BC), and that wildland fires were a significant source of the highest PM2.5 (>10 μg m−3) and BC events. A six-factor positive matrix factorization (PMF) model solution explained 95% of the measured PM2.5 and 78% of the measured ΣPAH. Five sources significantly contributed to PM2.5 including: Biomass Combustion (3.57 μg m−3; 40%); Fugitive Dust (1.86 μg m−3; 28%); Upgrader Stack Emissions (1.44 μg m−3; 21%); Petrogenic PAH (1.20 μg m−3; 18%); and Transported Aerosol (0.43 μg m−3 and 6%). However, the analysis indicated that only the pyrogenic PAH source factor significantly contributed (78%) to the measured ΣPAH. A five-factor PMF model dominated by fugitive dust sources explained 98% of PM10–2.5 mass and 86% of the ΣPAH. The predominant sources of PM10–2.5 mass were (i) Haul Road Dust (4.82 μg m−3; 53%), (ii) Mixed Fugitive Dust (2.89 μg m−3; 32%), (iii) Fugitive Oil Sand (0.88 μg m−3; 10%), Mobile Sources (0.23 μg m−3; 2%), and Organic Aerosol (0.06 μg m−3; 1%). Only the Organic Aerosol source significantly contributed (86%) to the measured ΣPAH.
Keywords: Fugitive dust, Biomass combustion, PM2.5, PM10, PAHs, PACs
Determination of polynuclear aromatic hydrocarbons, dibenzothiophene, and alkylated homologs in the lichen Hypogymnia physodes by gas chromatography using single quadrupole mass spectrometry and time-of-flight mass spectrometry
Development of the Athabasca Oil Sands Region in northeastern Alberta, Canada has contributed polycyclic aromatic hydrocarbons (PAHs) and polycyclic aromatic compounds (PACs), which include alkyl PAHs and dibenzothiophenes, to the regional environment. A new analytical method was developed for quantification of PAHs and PACs in the epiphytic lichen bioindicator species Hypogymnia physodes for use in the development of receptor models for attribution of PAH and PAC concentrations to anthropogenic and natural emission sources. Milled lichens were extracted with cyclohexane, and extracts were cleaned on silica gel using automated solid phase extraction techniques. Quantitative analysis was performed by gas chromatography with selected ion monitoring (GC-SIM-MS) for PAHs, and by GC with time-of-flight mass spectrometry (GC-TOF-MS) for PACs. PACs were quantitated in groups using representative reference compounds as calibration standards. Analytical detection limits were ≤2.5 ng g−1 for all individual compounds. Precision as measured by laboratory duplicates was variable; for individual analytes above 5 ng g−1 the mean absolute difference between duplicates was typically <20%. Selection of single-analyte markers for source attribution should include consideration of data quality indicators. Use of TOF-MS to spectrally characterize PAC group constituents identified significant challenges for the accurate quantitation of PACs with more than two carbons in their side chain(s). Total PAH concentrations in lichen samples ranged from 12 to 482 ng g−1. Total PACs in each sample varied from a fraction of total PAHs to more than four times total PAHs. Results of our analyses of H. physodes are compared with other studies using other species of lichens as PAH receptors and with passive monitoring data using polyurethane foam (PUF) samplers in the Athabasca Oil Sands Region (AOSR). This study presents the first analytical methodology developed for the determination of PACs in an epiphytic lichen bioindicator species.
Keywords: Polycyclic aromatic hydrocarbons, Polycyclic aromatic compounds, Lichens, Oil sands, Gas chromatography with time of flight mass spectrometry, Dibenzothiophene
Coupling lead isotope ratios and multi-element analysis of particulate matter and lichens from the Athabasca Oil Sands Region to identify local, regional, and global source contributions
Ambient air particulate matter (PM) was collected at the Wood Buffalo Environmental Association (WBEA) AMS-1 Fort McKay monitoring station in the Athabasca Oil Sand Region (AOSR) in northeastern Alberta, Canada from February 2010 to July 2011. Daily 24 hour integrated fine (PM2.5) and coarse (PM10-2.5) PM was collected using a sequential dichotomous sampler. A subset of 100 filter pairs were selected for element and lead (Pb) isotope analysis to determine short term variation in source contributions. Pb isotope results from 250 epiphytic lichen samples collected in 2008, 2011, and 2014 were also analyzed to examine longer term spatially resolved source contributions. Coupled measurements of multi-elements and 206Pb/207Pb and 208Pb/207Pb isotope ratios were used to identify local, regional, and global sources in the PM and lichen data sets. The key for identifying the global source term was the recognition of thorogenic 208Pb from eastern Asia in plots of 206Pb/207Pb versus 208Pb/207Pb. Combined results from the coarse and fine PM indicate fine PM contributions from eastern Asia (34%) exceed mixed sources of fine PM from the AOSR (20%), regional western Canada sources of fine PM (19%), and coarse PM from oil sands (14%), tailings (10%), and haul and access road (3%) sources. The results from the spatially resolved lichen analysis indicate regional sources contribute 46% of the Pb, local sources 32%, and global sources 22% over the 2008-2014 timeframe. If the mixing model results from the lichens collected in close proximity to oil sands production facilities (0-30 km) and those lichens collected in distal locations (30-160 km) are categorized, local sources dominate atmospheric deposition at the proximal sites, and regional and global sources are more important at the distal sites. The sensitivity of the Pb isotope approach is highlighted by its ability to identify and quantify the amount of the globally transported Pb atmospheric deposition contribution within the footprint of the world’s largest concentration of bitumen mining and upgrading facilities.
Keywords: Pb isotopes, Particulate Matter, Fugitive Dust, Asian Sources, Global Transport
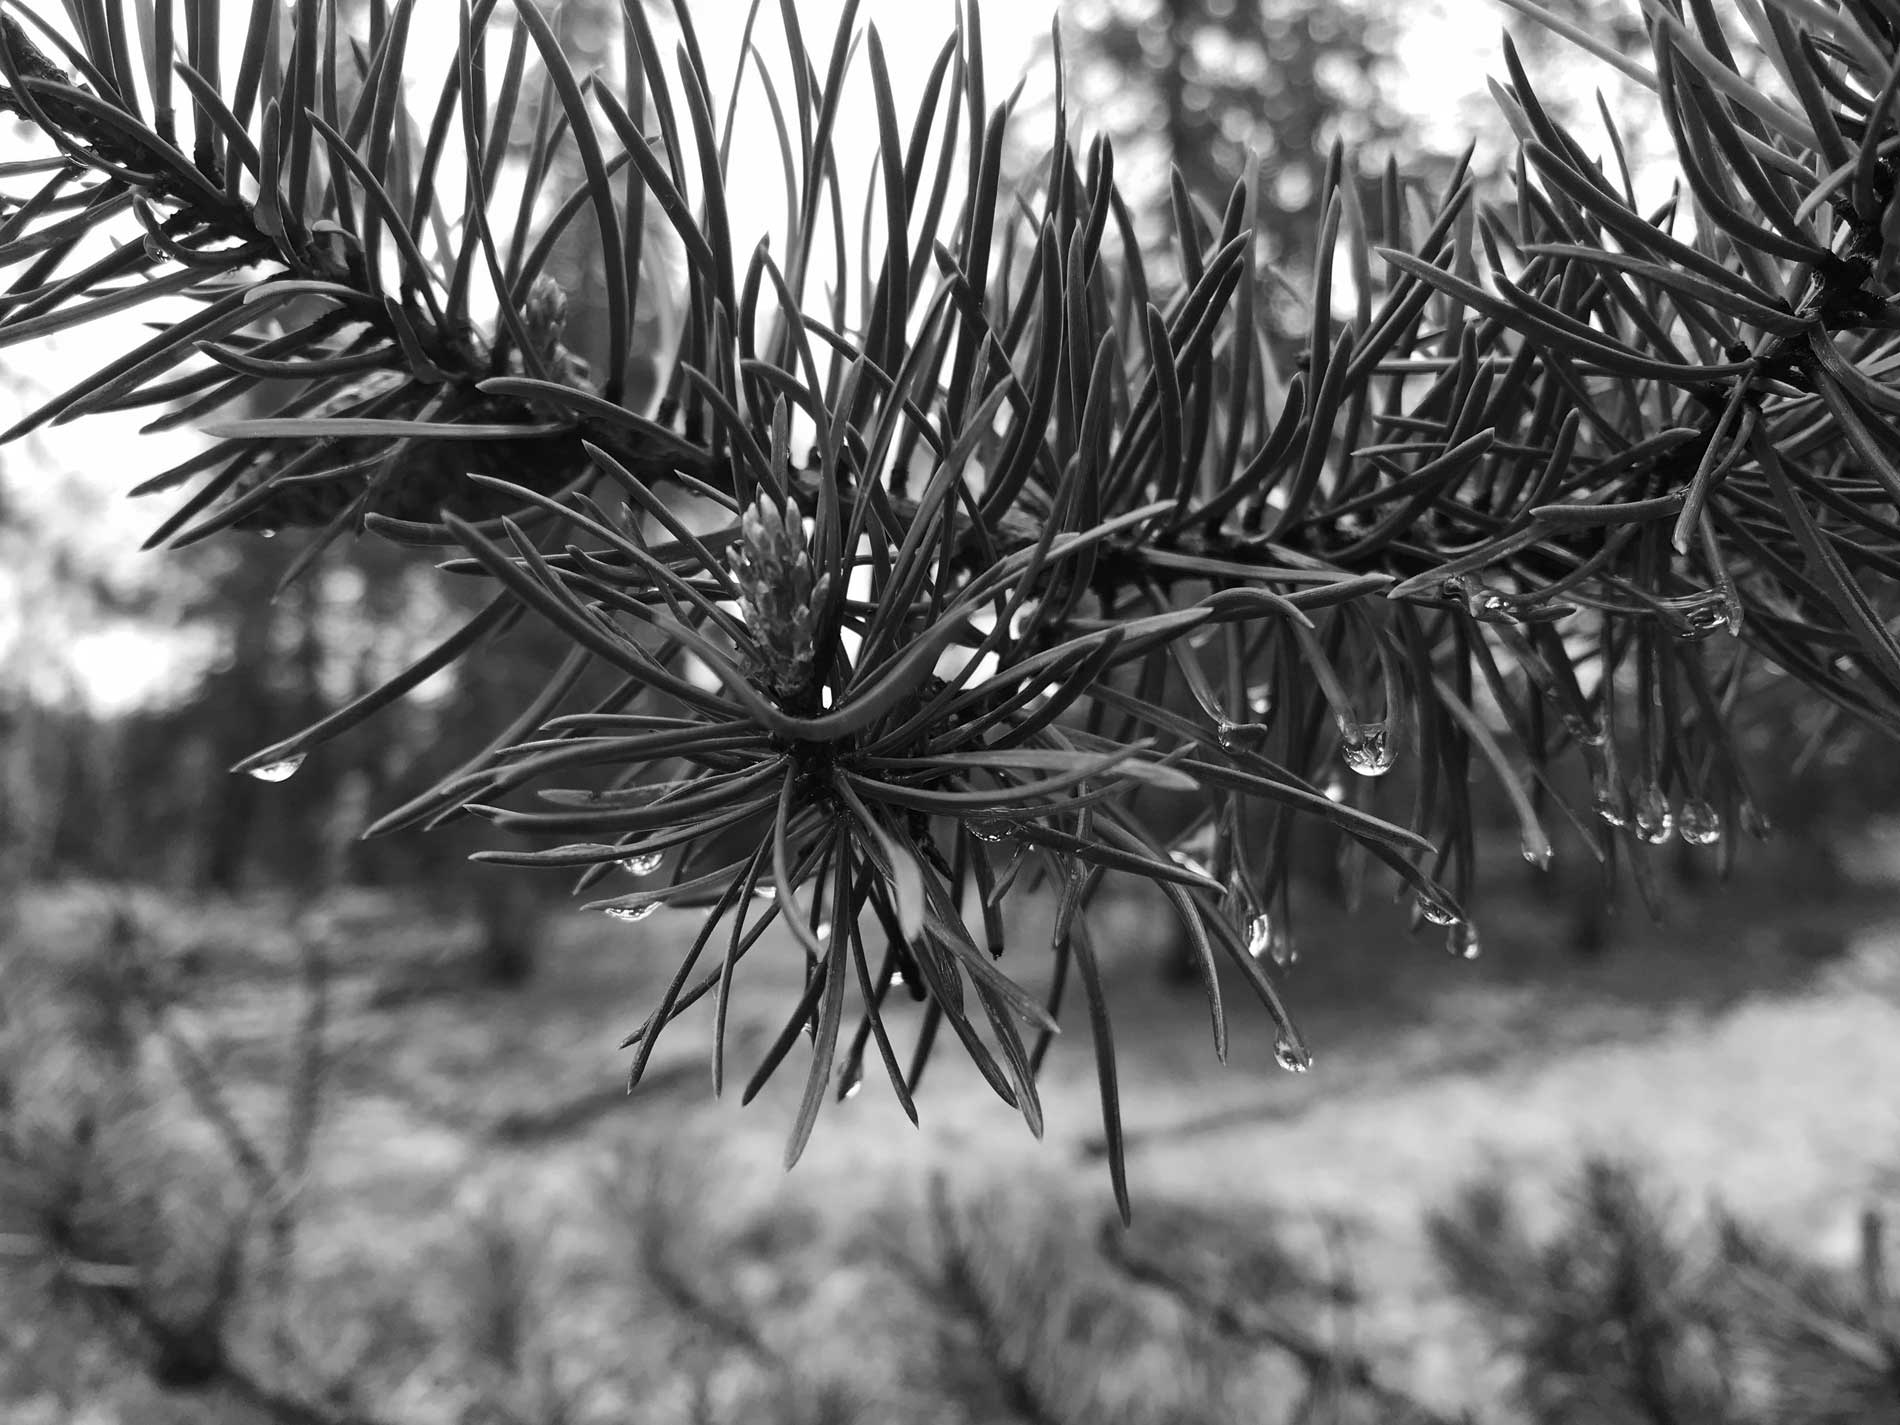
Foliage Chemistry of Pinus Banksiana in the Athabasca Oil Sands Region, Alberta, Canada.
Industrial emissions in the Athabasca Oil Sands Region (AOSR), Alberta, Canada, have caused concerns about the effect of oil sands operations on the surrounding terrestrial environments, including jack pine (Pinus banksiana Lamb.) stands. We collected jack pine needles from 19 sites in the AOSR (13–128 km from main operations) for foliar chemical analyses to investigate the environmental impact on jack pine. Pine needles from three age classes, the current annual growth (CAG, 2011), one year and two year old pine needles, were collected. Samples were analyzed for total carbon (TC), nitrogen (TN), and sulfur (TS), inorganic S (SO4-S), base cations (Ca, Mg, Na), and other elements (B, Cu, Fe, Mn, P, Zn); CAG needles were also analyzed for their nitrogen and carbon isotopic compositions. Only TN, TS, Ca, B, Zn, and Fe contents showed weak but significant increases with proximity to the major oil sands operations. C and N isotopic compositions showed no trend with distance or TC and TN contents. Total S contents in CAG of pine foliage increased significantly with proximity to the main industrial operation while foliar inorganic S to organic S ratios (SO4-S/Sorg) ranged consistently between 0.13 and 0.32, indicating low to moderately high S loading. Hence, this study suggests some evidence of uptake of S emissions in close proximity to anthropogenic sources, although the reported values have not reached a level of environmental concern.
Keywords: Foliage, jack pine, nitrogen, carbon, isotopes, Athabasca oil sands
Atmospheric dry deposition of sulfur and nitrogen in the Athabasca Oil Sands Region, Alberta, Canada
Due to the potential ecological effects on terrestrial and aquatic ecosystems from atmospheric deposition in the Athabasca Oil Sands Region (AOSR), Alberta, Canada, this study was implemented to estimate atmospheric nitrogen (N) and sulfur (S) inputs. Passive samplers were used to measure ambient concentrations of ammonia (NH3), nitrogen dioxide (NO2), nitric acid/nitrous acid (HNO3/HONO), and sulfur dioxide (SO2) in the AOSR. Concentrations of NO2 and SO2 in winter were higher than those in summer, while seasonal differences of NH3 and HNO3/HONO showed an opposite trend, with higher values in summer. Concentrations of NH3, NO2 and SO2 were high close to the emission sources (oil sands operations and urban areas). NH3 concentrations were also elevated in the southern portion of the domain indicating possible agricultural and urban emission sources to the southwest. HNO3, an oxidation endpoint, showed wider ranges of concentrations and a larger spatial extent. Concentrations of NH3, NO2, HNO3/HONO and SO2 from passive measurements and their monthly deposition velocities calculated by a multi-layer inference model (MLM) were used to calculate dry deposition of N and S. NH3 contributed the largest fraction of deposited N across the network, ranging between 0.70–1.25 kg N ha−1 yr−1, HNO3/HONO deposition ranged between 0.30–0.90 kg N ha−1 yr−1, and NO2 deposition between 0.03–0.70 kg N ha−1 yr−1. During the modeled period, average dry deposition of the inorganic gaseous N species ranged between 1.03 and 2.85 kg N ha−1 yr−1 and SO4-S deposition ranged between 0.26 and 2.04 kg ha−1 yr−1. Comparisons with co-measured ion exchange resin throughfall data (8.51 kg S ha−1 yr−1) indicate that modeled dry deposition combined with measured wet deposition (1.37 kg S ha−1 yr−1) underestimated S deposition. Gas phase NH3 (71%) and HNO3 plus NO2 (79%) dry deposition fluxes dominated the total deposition of NH4-N and NO3-N, respectively.
Keywords: Passive sampler, Atmospheric dry deposition, Nitrogen, Sulfur, Multi-layer inference model, Throughfall measurement
Collocated Comparisons between the Continuous and Filter-Based PM2.5 Measurements at Fort McMurray, Alberta, Canada
Collocated comparisons for three PM2.5 monitors were conducted from June 2011 to May 2013 at an air monitoring station in the residential area of Fort McMurray, Alberta, Canada, a city located in the Athabasca Oil Sands Region. Extremely cold winters (down to approximately −40°C) coupled with low PM2.5 concentrations present a challenge for continuous measurements. Both the tapered element oscillating microbalance (TEOM), operated at 40°C (i.e., TEOM40), and Synchronized Hybrid Ambient Real-time Particulate (SHARP, a Federal Equivalent Method [FEM]), were compared with a Partisol PM2.5 U.S. Federal Reference Method (FRM) sampler. While hourly TEOM40 PM2.5 were consistently ~20–50% lower than that of SHARP, no statistically significant differences were found between the 24-hr averages for FRM and SHARP. Orthogonal regression (OR) equations derived from FRM and TEOM40 were used to adjust the TEOM40 (i.e., TEOMadj) and improve its agreement with FRM, particularly for the cold season. The 12-year-long hourly TEOMadj measurements from 1999 to 2011 based on the OR equations between SHARP and TEOM40 were derived from the 2-year (2011–2013) collocated measurements. The trend analysis combining both TEOMadj and SHARP measurements showed a statistically significant decrease in PM2.5 concentrations with a seasonal slope of −0.15 μg m−3 yr−1 from 1999 to 2014.Implications: Consistency in PM2.5 measurements are needed for trend analysis. Collocated comparison among the three PM2.5 monitors demonstrated the difference between FRM and TEOM, as well as between SHARP and TEOM. The orthogonal regressions equations can be applied to correct historical TEOM data to examine long-term trends within the network.
Characterization of PM2.5 and PM10 fugitive dust source profiles in the Athabasca Oil Sands Region
Geological samples were collected from 27 representative locations in the Athabasca Oil Sands Region (AOSR) in Alberta, Canada. These samples were resuspended onto filter substrates for PM2.5 and PM10 size fractions. Samples were analyzed for 229 chemical species, consisting of elements, ions, carbon, and organic compounds. These chemical species are normalized to gravimetric mass to derive individual source profiles. Individual profiles were grouped into six categories typical of those used in emission inventories: paved road dust, unpaved road dust close to and distant from oil sand operations, overburden soil, tailings sands, and forest soils. Consistent with their geological origin, the major components are minerals, organic and elemental carbon, and ions. The sum of five major elements (i.e., Al, Si, K, Ca, and Fe) and their oxidized forms account for 25–40% and 45–82% of particulate matter (PM) mass, respectively. Si is the most abundant element, averaging 17–18% in the Facility (oil sand operations) and 23–27% in the Forest profiles. Organic carbon is the second most abundant species, averaging 9–11% in the Facility and 5–6% in the Forest profiles. Elemental carbon abundance is 2–3 times higher in Facility than Forest profiles. Sulfate abundance is ~7 times higher in the Facility than in the Forest profiles. The ratios of cation/anion and base cation (sum of Na+, Mg2+, K+, and Ca2+)/nitrogen- and sulfur-containing ions (sum of NH4+, NO2–, NO3–, and SO42-) exceed unity, indicating that the soils are basic. Lead (Pb) isotope ratios of facility soils are similar to the AOSR stack and diesel emissions, while those of forest soils have much lower 206Pb/207Pb and 208Pb/207Pb ratios. High-molecular-weight n-alkanes (C25-C40), hopanes, and steranes are more than an order of magnitude more abundant in Facility than Forest profiles. These differences may be useful for separating anthropogenic from natural sources of fugitive dust at receptors.
Measurement of fine particulate matter water-soluble inorganic species and precursor gases in the Alberta Oil Sands Region using an improved semi-continuous monitor
The ambient ion monitor–ion chromatography (AIM-IC) system, which provides hourly measurements of the main chemical components of PM2.5 (particulate matter with an aerodynamic diameter <2.5 μm) and its precursor gases, was evaluated and deployed from May to July 2011 and April to December 2013 in the Athabasca Oil Sands Region (AOSR) of northeastern Alberta, Canada. The collection efficiencies for the gas-phase SO2 and HNO3 using the cellulose membrane were 96% and 100%, respectively, and the collection efficiency of NH3 using the nylon membrane was 100%. The AIM-IC was compared with a collocated annular denuder sampling system (ADSS) and a Federal Reference Method (FRM) Partisol PM2.5 sampler. The correlation coefficients of SO42− concentrations between the AIM-IC and ADSS and between the AIM-IC and the Partisol PM2.5 sampler were 0.98 and 0.95, respectively. The comparisons also showed no statistically significant difference between the measurement sets, suggesting that the AIM-IC measurements of the PM2.5 chemical composition are comparable to the ADSS and Partisol PM2.5 methods. NH3 concentration in the summer (mean ± standard deviation, 1.9 ± 0.7 µg m−3) was higher than in the winter (1.3 ± 0.9 µg m−3). HNO3 and NO3− concentrations were generally low in the AOSR, and especially in the winter months. NH4+ (0.94 ± 0.96 µg m−3) and SO42− (0.58 ± 0.93 µg m−3) were the major ionic species of PM2.5. Direct SO2 emissions from oil sands processing operations influenced ambient particulate NH4+ and SO42− values, with hourly concentrations of NH4+ and SO42− measured downwind (~30 km away from the stack) at 10 and 28 µg m−3. During the regional forest fire event in 2011, high concentrations of NO3−, NH4+, HNO3, NH3, and PM2.5 were observed and the corresponding maximum hourly concentrations were 31, 15, 9.6, 89, and >450 (the upper limit of PM2.5 measurement) µg m−3, suggesting the formation of NH4NO3.