Skip to content

The data can be accessed from three types of monitoring stations

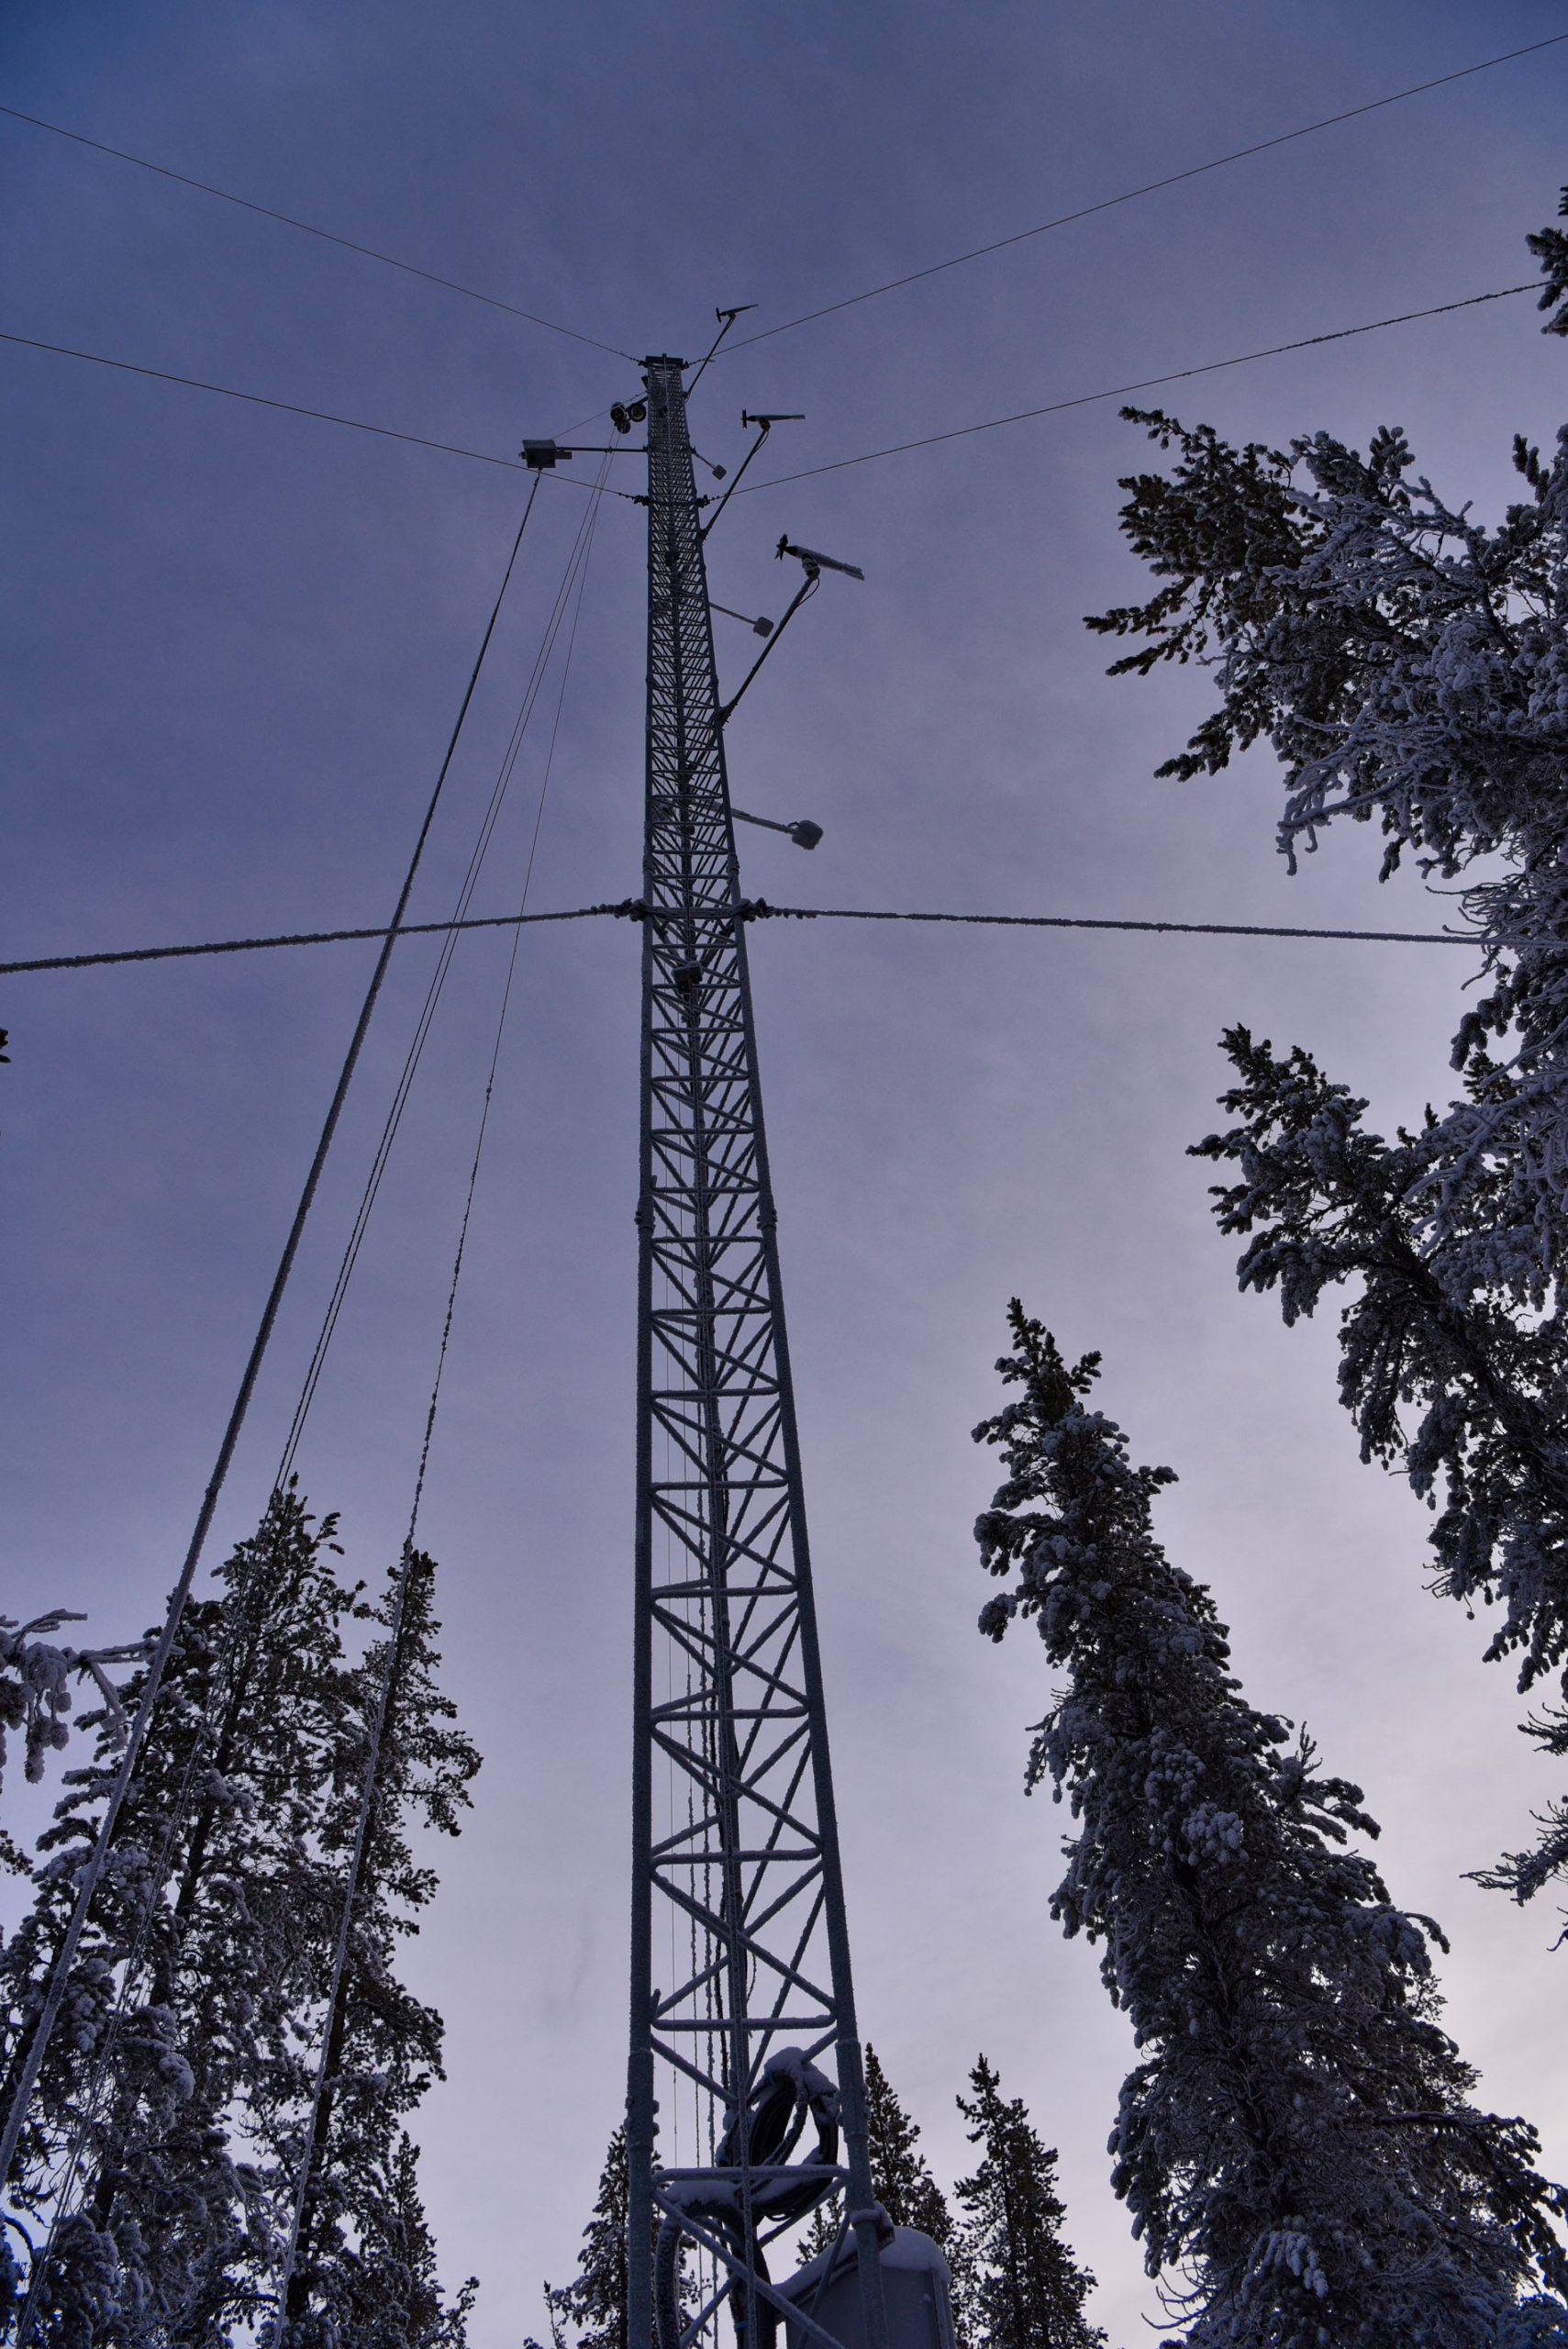
The WBEA has data available from over 25 continuous air monitoring stations, 6 meteorological towers and 50+ integrated monitoring sites. Knowing the specifics of the data type you wish to download or view is helpful in finding the right place to acquire the data. Use this guide to better understand how to find and access the WBEA’s data.

Station Data

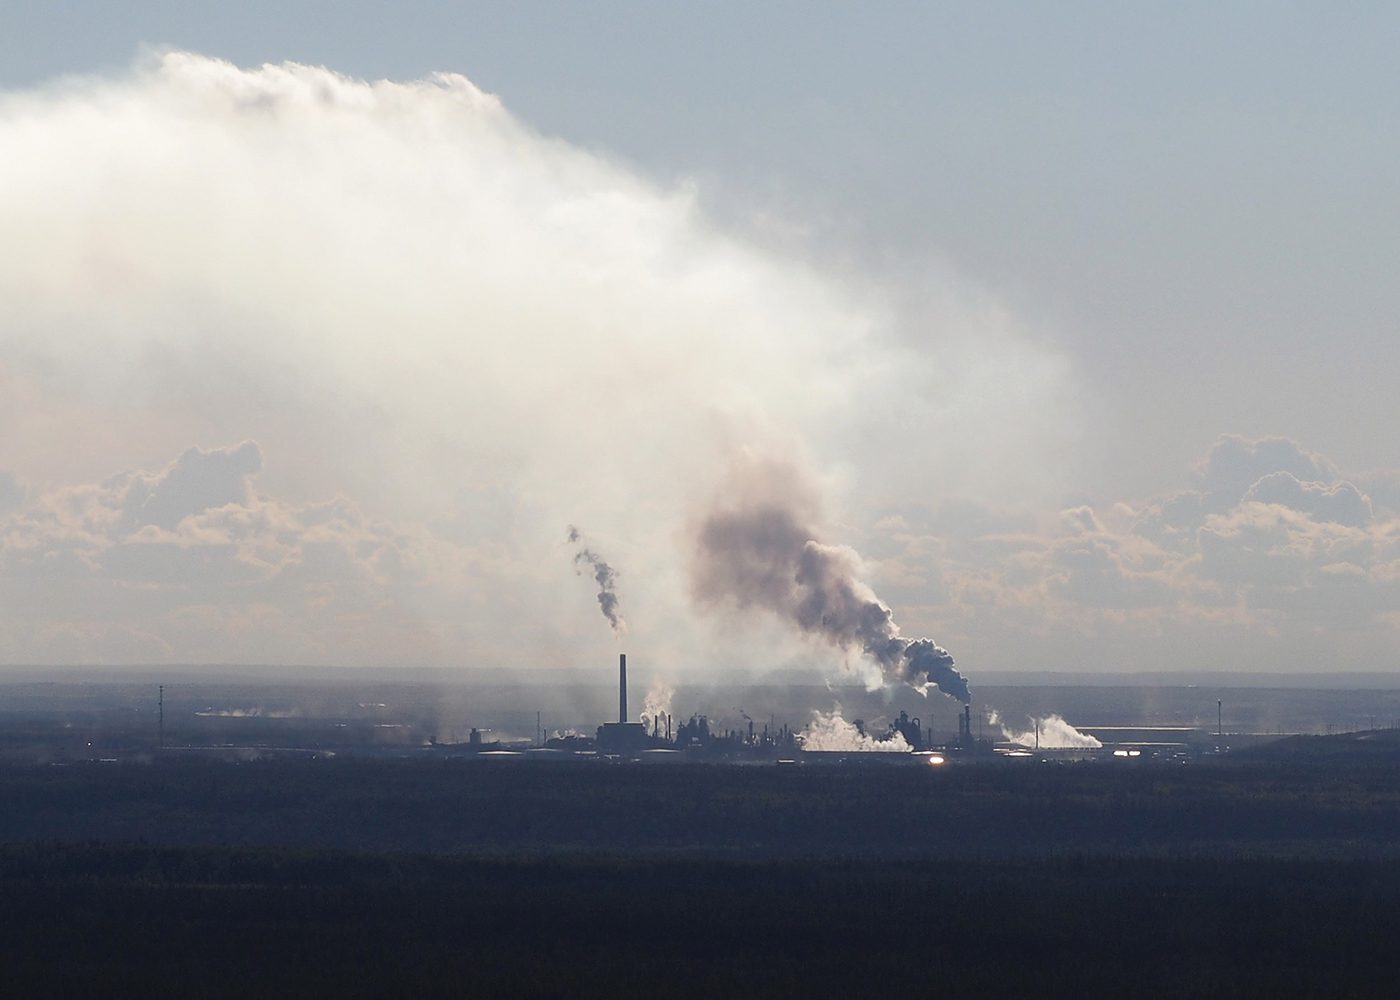
The WBEA monitors ambient air in the RMWB 24-hours a day, 365 days a year, through a network of 29 stations, including continuous and time-integrated air monitoring methods. An interactive monitoring network map shows the station locations and near-real-time (Level 1) air data for each station.

View Real-Time Station Data

Continuous Data

The WBEA has staff dedicated to validating the continuous data that is collected within its network. This quality-controlled (Level 2) air data, including historical monitoring data, is available by visiting Continuous Monitoring Data.

View Validated Continuous Data

Time-Integrated Data

Non-continuous monitoring consists of collecting air samples or exposing pollutant-sensitive, chemically treated sample media to the atmosphere for a period of time. The air pollutant concentrations are determined by laboratory analysis and shared by the WBEA.

View Time-Integrated Data

WBEA's Air Data Report's

As required by the Alberta Air Monitoring Directive (AMD), the WBEA submits monthly and annual Air Monitoring Reports and Quality Assured Data to Alberta Environment and Protected Areas (EPA). These reports provide an overview and evaluation of the monitoring performed during the year. They also provide an additional review to the data and present summaries that highlight overall performance, seasonal patterns, annual trends, and exceedances of the Alberta Ambient Air Quality Objectives and Guidelines (AAAQO/G). All of WBEA’s reports are found under WBEA Resources.

View WBEA Resources

Annual Trends

The WBEA’s Annual Trends site is intended to compare data annually and visually present data trends over time. There are three primary sections to view data trends: continuous and time-integrated data for specific air quality parameters, ground-level concentration exceedances, and analyzer average operational time.

View Website

Community Odour Monitoring Program

The Community Odour Monitoring Program (COMP) allows residents to submit information about the odours they experience in the Regional Municipality of Wood Buffalo. The COMP webpage reports the submitted odour observations in near-real time, as well as provides more information about the program, odours, and the COMP annual reports. The annual reports provide a comparison between odours observed and ambient air quality data to determine if there is a relationship between regional odours and air quality.

View Website

Air Quality Events

The WBEA identifies all detected exceedances of the provincial objectives for air quality, and reports them through the Air Quality Events (AQE) webpage and its AQE App to inform stakeholders and partners. The AQE page provides historical and near-real time air quality events, including the status of each detected AQE, and additional information about the relevant thresholds.

View events