Photo from the air over a lake in the middle of the forest

2021 WBEA
Annual
Report

Your independent air quality reporter.

The Wood Buffalo Environmental Association (WBEA) is your independent air quality reporter. Now in our 25th year, the WBEA continues to serve the Regional Municipality of Wood Buffalo (RMWB) with a complete picture of regional air quality 24 hours a day, 365 days a year.

Wood buffalo in the field

The WBEA Today

Our Focus

From our earliest days the WBEA’s operational objective has focused on a simple vision; the monitoring, collection, and dissemination of high quality, transparent ambient air data as broadly as possible.

It is our intention that the information found within our 2021 Annual Report will empower our stakeholders and partners —including industry and government, Indigenious communities, and the public at large—to affect positive change, make informed decisions, and ensure a safe and healthy environment today, and in the years to come.

The WBEA believes in empowering user groups to make informed decisions through the provision of transparent, accurate, and timely data. This report aims to provide our partners, and stakeholders with the complete picture of our work, our values and our continued mission and priorities for the region we serve.

Who We Are

Scientifically independent and consensus-driven, the WBEA relies on careful implementation of the best available scientific practices and technology. This commitment-along with the respectful application of Traditional Knowledge and teaching-provides regional stakeholders, community partners, and the public with the most transparent, accurate, and timely ambient air data possible.

Vision

People are empowered to make informed decisions to ensure a safe and healthy environment.

Mission

The Wood Buffalo Environmental Association is a multi-stakeholder, consensus-based organization that leads in state-of-the-art environmental montioring to enable informed decision-making.

Core Values

Our values are as diverse as the region we serve and include:

  • We are scientifically independent.
  • We recognize, respect, and use Traditional Knowledge.
  • We are transparent and timely in communicating accurate and accessible data.
  • We are dedicated to using best available practices and technology.
  • We support diverse stakeholder participation to achieve consensus-based decisions.

Organizational Structure

The General Members Board and Governance Committee provide strategic direction and oversight for the organization. The Technical Committees determine the strategic plans and direction for each of the WBEA's monitoring programs. The Executive Director provides operational direction for the WBEA staff, engaging science and technical advisors as required, to ensure stewardship to the overarching direction set by the General Members Board and Governance Committee.

Organization Chart

WBEA Monitoring Network

  • All Stations
  • WBEA Boundary
  • Ambient Air - Continuous Sites
  • Regional Meteorology Towers
  • Deposition - Denuder Sites
  • Deposition - Forest Health Sites
  • Deposition - Ion Exchange Resin Sites
  • Deposition - Portable Ozone Monitor Sites

This map shows the locations for all monitoring stations in 2021 within the WBEA monitoring network. For more information on these stations, please visit wbea.org/network-and-data/monitoring-stations.

WBEA Monitoring Programs

Partners in Air Quality Reporting

Alberta Environment & Parks (AEP)

Alberta Environment and Parks (AEP) is responsible for monitoring, evaluating, and reporting on key air, water, land, and biodiversity indicators. The mandate within the ministry is to provide open and transparent access to scientific data and information on the condition of Alberta's environment, including specific indicators as well as cumulative effects, both provincially and in specific locations. The Oil Sands Monitoring (OSM) Program is a joint federal and provincial initiative between the Government of Alberta and Environment and Climate Change Canada. The mandate of the program is to implement an ambient environmental monitoring program in the oil sands region that integrates air, water, land, and biodiversity. The OSM Program strives to improve characterization of the state of the environment and enhance understanding of the cumulative effects of oil sands development.

The WBEA has entered into a contractual agreement with AEP. As a working partner, the WBEA is one of the agencies helping to ensure that the OSM Program is delivered with the best expertise possible.

Learn More
River running through a thick forest from above

WBEA within
Alberta Airsheds

Alberta’s Airsheds Council

The WBEA is a member of the Alberta Airsheds Council (AAC), which is a partnership of Alberta's Airsheds and provides leadership in support of healthy air quality for Albertans and the environment.

Initiated in 2006, the AAC includes membership from all ten Airsheds in Alberta and was formed to represent the collective interests of this collaborative group.

The AAC provides a forum for Airsheds to work and learn together, to continue to advance effective and efficient air monitoring, reporting and outreach, and to address regional matters.

  1. Alberta Capital Airshed (ACA)
  2. Calgary Region Airshed Zone (CRAZ)
  3. Lakeland Industry and Community Association (LICA)
  4. Fort Air Partnership (FAP)
  5. Palliser Airshed Society (PAS)
  6. Parkland Airshed Management Zone (PAMZ)
  7. Peace Airshed Zone Associations (PAZA)
  8. West Central Airshed Society (WCAS)
  9. WBEA
  10. Peace River Area Monitoring Program Committee (PRAMP)
Reflection of the sky in a lake

Ambient Air Monitoring

The WBEA operated 29 ambient air monitoring stations in 2021 throughout the RMWB. These included industrial, attribution, community, background, and meteorological stations. The image below demonstrates how the WBEA collects ambient air data through continuous analyzers and time-integrated samplers to ensure residents and stakeholders have the information they need to make informed environmental decisions.

  • All WBEA air monitoring data are fully quality-assured and then sent by the end of the following month to airdata.alberta.ca, an AEP on-line database for all of Alberta's ambient air quality data.
  • All of the WBEA's data can also be found on our website at wbea.org.
  • The WBEA’s Ambient Air Annual Report 2021 contains detailed information related to the data collected in the WBEA’s monitoring network.

WBEA Annual Trends Website

Ambient air monitoring infographic.
Number 1 image

Source

Pollution is emitted into the air from a variety of sources

Number 2 image

Measure

The WBEA ambient air monitoring stations measures the concentrations of pollutants in the air

Number 3 image

Share

The information the WBEA collects is available to view on wbea.org and is used to calculate the air quality health index (AQHI)

Air Quality Health Index

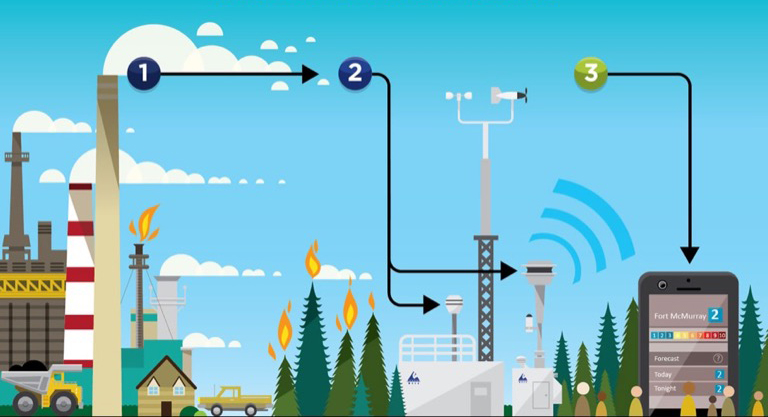
Alberta’s Air Quality Health Index—AQHI—is a scale created to help individuals better understand the impact of air quality on their health by providing important ambient air data at a glance. AQHI helps the public make informed decisions to protect their health by limiting short-term exposure to air pollution and adjusting activity levels during increased levels of air pollution. The WBEA reports AQHI ratings from nine of its continuous monitoring stations in the Wood Buffalo region.

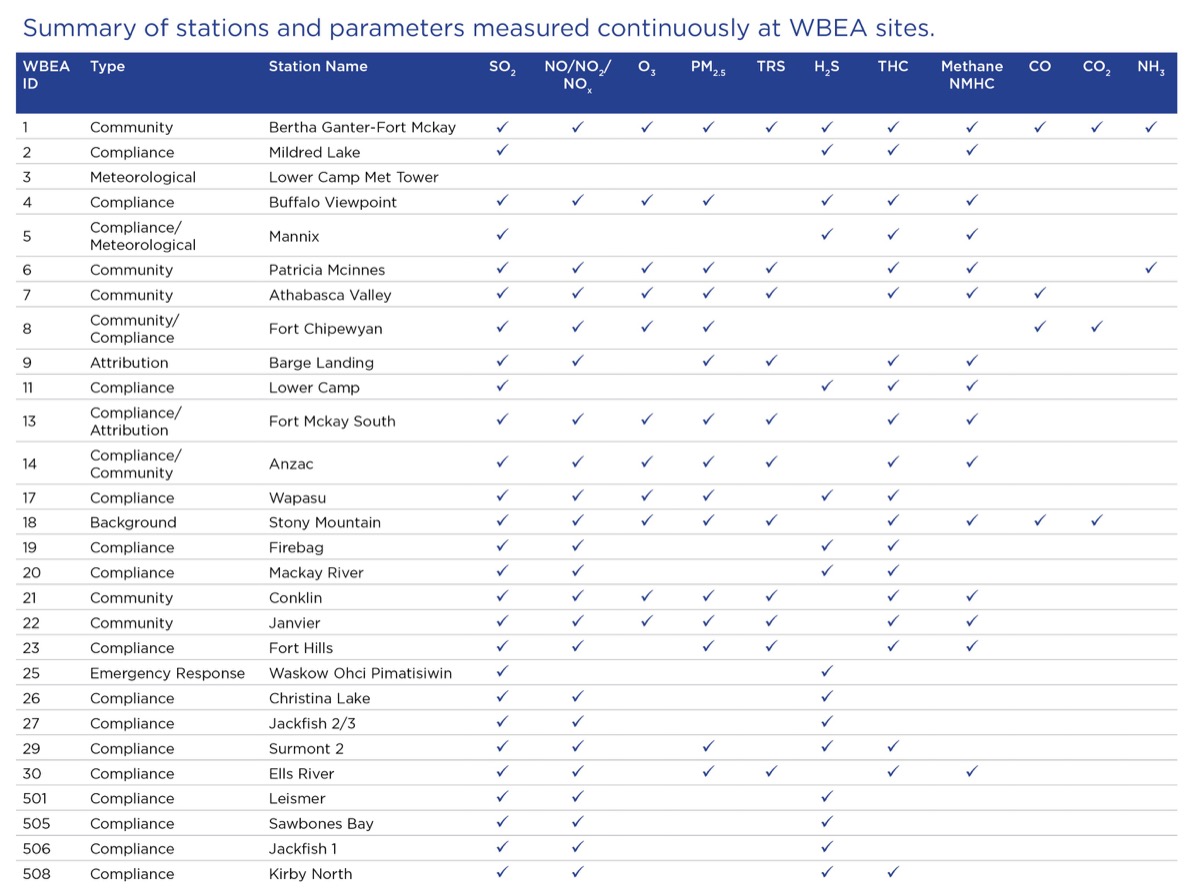
Primary compounds measured and used to calculate the AQHI are nitrogen dioxide (NO2), fine particulate matter (PM2.5), and ground-level ozone (O3)—all of which can negatively impact an individual’s respiratory system.

As an additional precaution, AQHI hourly pollutant concentrations are also compared against Alberta’s Ambient Air Quality Objectives (AAAQOs). If an exceedance is detected by the province, the AQHI will report a HIGH or VERY HIGH ambient air risk value.

While the AQHI network relies on WBEA ambient air data, odour causing compounds measured in the network are not considered, therefore index data does not describe the potential for odour events.

The community of Fort McKay has also developed its own Fort McKay Air Quality Index (FMAQI), based on the data collected by the WBEA at its Bertha Ganter-Fort McKay air monitoring station. The FMAQI is independent of the provincial AQHI, and includes compounds that can indicate odours, such as Total Reduced Sulphur (TRS), total hydrocarbons (THC), and sulphur dioxide (SO2).

Learn More AQHI Learn More FMAQI

2021 Hourly AQHI by Station

Low Risk 98.71%

Moderate Risk 1.00%

High Risk 0.29%

Very High Risk 0.00%

Low Risk 98.26%

Moderate Risk 1.30%

High Risk 0.44%

Very High Risk 0.00%

Low Risk 99.05%

Moderate Risk 0.90%

High Risk 0.05%

Very High Risk 0.00%

Low Risk 97.23%

Moderate Risk 2.57%

High Risk 0.20%

Very High Risk 0.00%

Low Risk 95.02%

Moderate Risk 4.78%

High Risk 0.20%

Very High Risk 0.00%

Low Risk 97.94%

Moderate Risk 1.54%

High Risk 0.52%

Very High Risk 0.00%

Low Risk 98.49%

Moderate Risk 1.11%

High Risk 0.39%

Very High Risk 0.00%

Low Risk 96.85%

Moderate Risk 2.83%

High Risk 0.33%

Very High Risk 0.00%

Low Risk 97.39%

Moderate Risk 2.31%

High Risk 0.29%

Very High Risk 0.00%

Birch trees in a forest

Ambient Air Quality Standards

The WBEA’s ambient air quality data is compared to several established air quality thresholds, triggers, and limits, including the World Health Organization Air Quality Guidelines, the Canadian Ambient Air Quality Standards, Alberta’s Ambient Air Quality Objectives and Guidelines, and the Lower Athabasca Regional Plan’s trigger levels and limits.

World Health Organization Air Quality Guidelines

The World Health Organization (WHO) Air Quality Guidelines offer guidance on threshold limits for key air pollutants that pose health risks and provide a reference for setting air pollution targets at regional and national levels to improve air quality. The WHO provides additional details in their guideline publication.

Parameter Averaging Period Objective or Guideline Value Units
Fine Particulate Matter (PM2.5) 24-hour 99th percentile 25 µg/m3
Annual 10 µg/m3
Nitrogen Dioxide (NO2) 1-hour 105 ppb
Annual 21 ppb
Ozone (O3) 8-hour daily maximum 100 ppb
Sulphur Dioxide (SO2) 24-hour 48 ppb
Annual 20 ppb

Canadian Ambient Air Quality Standards

The Canadian Ambient Air Quality Standards (CAAQS) are national air quality standards that are designed to protect human health and the environment. The CAAQS inform the development of management plans and appropriate management actions required to improve air quality. The CAAQS, which are based on three years of data, are targeted to assess air quality issues that can be controlled locally through management actions (such as emissions reductions). The Government of Alberta provides additional information about CAAQS on their website.

The table below provides a summary of the CAAQS for 2020 and 2025.

Contaminant Average Time Numerical Value Effective Statistical Form of the Standard (Metric)
2020 2025
NO2 (ppb) Annual 17 12 Arithmetic average over a single calendar year of all NO2 1-hour average concentrations in the year
1-hour 60 42 3-year average of the annual 98th percentile of the NO2 daily maximum 1-hour average concentrations
SO2 (ppb) Annual 5 4 Arithmetic average over a single calendar year of all SO2 1-hour average concentrations in the year
1-hour 70 65 3-year average of the annual 99th percentile of the SO2 daily maximum 1-hour average concentrations
O3 (ppb) 8-hour 62 60 3-year average of the annual 4th highest of the daily maximum 8-hour average ozone concentrations
PM2.5 (µg/m3) Annual 10 8.8 3-year average of the annual average of all 1-hour concentrations
24-hour 28 27 3-year average of the annual 98th percentile of the daily 24-hour average concentrations

Alberta Ambient Air Quality Objectives & Guidelines

Alberta's Ambient Air Quality Objectives (AAAQOs) and Ambient Air Quality Guidelines (AAAQGs) were developed under the Alberta Environmental Protection and Enhancement Act (EPEA) to protect Alberta's air quality. AAAQOs help assess industry compliance and evaluate facility performance, and AAAQGs are a general performance indicator used to help with airshed planning and management. Both are established for a variety of averaging periods depending on the characteristics of the pollutant.

The first graph below presents a total count of air quality event exceedances at all WBEA ambient air monitoring stations over a five-year period for AAAQOs from 2016-2021. Since the PM2.5 1-hour AAAQG was established in 2019, exceedance data available from 2019 and 2021 are included in the graph. The second graph shows the exceedances for 2021 based on station locations.

Parameter 1-hour Average 8-hour Average 24-hour Average 30-day Average Annual Average
AAAQO
Sulphur Dioxide (SO2) 172 ppb - 48 ppb 11 ppb 8 ppb
Nitrogen Dioxide (NO2) 159 ppb - - - 24 ppb
Ozone (O3) 76 ppb - - - -
Total Reduced Sulphur (TRS)
/ Hydrogen Sulphide (H2S)*
10 ppb - 3 ppb - -
Fine Particulate Matter 2.5 (PM2.5) - - 29 μg/m3 - -
Carbon Monoxide (CO) 13 ppm 5 ppm - - -
Ammonia (NH3) 2 ppm - - - -
AAAQG
PM2.5 80 μg/m3 - - - -

*In the WBEA network TRS concentrations are reported using the H2S AAAQOs.

Note: Forest fire season was considered to be from March 1 – October 31, 2021.
Note: The WBEA began reporting PM2.5 AAAQG exceedances in 2019 as per the Alberta Air Monitoring Directive (AMD) requirements; the graph shows exceedance data for only 2019 to 2021.

Reporting Air Quality Events

When ambient concentrations of any air pollutant the WBEA measures exceed the AAAQOs and AAAQGs, the WBEA has an Immediate Reporting Protocol that is put into action. WBEA analyzers continuously monitor ambient air, and in the event of an exceedance, the following steps are taken:

1. The data collection system automatically sends out alarm notifications to WBEA personnel and an independent third-party alarm monitoring company.

2. If an AAAQO is exceeded, the alarm company acknowledges the incoming alarm and reports the data and supporting information such as wind conditions, locations, time, etc. to Alberta Environment and Parks (AEP) in real time. AEP uses the data and information from the WBEA to follow up appropriately.

3. If an AAAQG is exceeded, the WBEA reports the data and supporting information such as wind conditions, locations, time, etc. to AEP during business hours. AEP uses the data and information from the WBEA to follow up appropriately.

4. If the exceedance occurs at an industry station, the owner is informed that they have exceeded an AAAQO or AAAQG, and they are provided with the same information that was given to AEP. They follow up with AEP and/or the Alberta Energy Regulator (AER), as required. Exceedances at community stations are followed up by the WBEA.

AQE app icon

WBEA's Air Quality Events (AQE) App

The WBEA has developed an Air Quality Events (AQE) app as another way to notify interested stakeholders and partners of air quality events related to AAAQO’s and AAAQG’s. The AQE app provides near-real time notifications when an exceedance occurs in the network and allows users to subscribe to the air monitoring stations of interest. The app is available for download on Apple and Android platforms. In addition, the AQE app stores all the historical and near real-time air quality events information on the Air Quality Events page of the WBEA website.

iOS Devices Android Devices
Vegitation stump fungi

LARP Triggers
& Limits

The Lower Athabasca Regional Plan (LARP) has existed as an extension of the Alberta Land-Use Framework since September 2012.

The LARP air quality objective is to manage releases from multiple sources so they do not collectively result in unacceptable air quality. LARP sets out trigger levels and limits for NO2 and SO2 as described in the table below. The WBEA provides AEP with the air quality data that is used to calculate the annual LARP triggers and limits. When a trigger is exceeded, AEP is required to create a regional management response.

The following graphs show the annual average and hourly 99th percentile concentrations of NO2 and SO2 at each station location compared to the respective triggers and limit for each parameter. The use of the hourly 99th percentile data is a statistical measure to indicate upper limits of the data. Increases in the 99th percentile beyond the LARP triggers can be an early warning to help inform appropriate management actions to prevent future exceedances.

Learn more about LARP

larp triggers table

Note: * Stations operational less than 75% of the time in 2021.

River outlet into a lake in the forest

Regional Wind Profiles

Meteorological parameters, including wind speed and direction, humidity, precipitation, atmospheric pressure, solar radiation, and the vertical temperature structure of the atmosphere, all impact the dispersion, deposition, and transformation of common air pollutants.

Wind rose plots provide visual context for the speed, direction, and frequency of winds, and are shown below for each WBEA community station in the network. The colours within each wind rose triangle denote the frequency of the wind speed (shown in the legend above the wind roses). Calms are shown for each community as a percentage of time that wind speeds are below 0.5 km/h.

For example, the largest triangle in Fort Chipewyan wind rose shows the wind comes from the east, about 17% of the time in 2021. The olive green colour in this triangle shows the wind was between 10 and 15 kilometers per hour (km/h) 4% of the time. Wind speeds were less than 0.5 km/h in Fort Chipewyan 0.06% of the time (calms).

WIND SPEED (km/h)

Calms: 0.07%

Tower Height: 20m

0.5 - 5

5 - 10

10 - 15

15 - 20

20 - 25

>= 25

NORTHSOUTHWESTEAST3%6%9%12%15%
NORTHSOUTHWESTEAST5%10%15%20%25%
NORTHSOUTHWESTEAST4%8%12%16%20%
NORTHSOUTHWESTEAST3%6%9%26%15%
NORTHSOUTHWESTEAST4%8%12%16%20%
NORTHSOUTHWESTEAST3%6%9%12%15%
NORTHSOUTHWESTEAST4%8%12%16%20%
Photo from the air of a river winding through the forest

Air Quality Parameters Monitored within the WBEA Network

Two key sampling methods are used by the WBEA for conducting high quality ambient air monitoring within its network: continuous, which generates raw air quality data in near real-time, and time-integrated or “non-continuous”. The graphs below provide an overview of each parameter measured, including its sampling method, in 2021.

View parameters measured at each station

As its title suggests, the WBEA’s continuous ambient air monitoring uses analyzers that continually measure concentrations of pollutants in the air. This data is readily available to anyone in near real-time on our website, wbea.org.

In addition to specific compounds, all stations continuously measure temperature, relative humidity, and wind speed and direction.

The data for continuous monitoring is presented in the following graphs as the annual hourly average (mean) concentrations of each parameter, along with the annual hourly 99th percentile and maximum concentrations. Please note, the averages may be too small to be visible on some graphs. The annual hourly 99th percentile is used to show the high end of concentrations measured at the WBEA air monitoring stations, after removing the highest 1% of events which may be outliers.

Note: Averages may be too small to be visible on some graphs. Hover over the graph to view specific values.

Sulphur Dioxide (SO2)

Nitrogen Dioxide (NO2)

Ozone (O3)

Carbon Monoxide (CO)

Carbon Dioxide (CO2)

Total Reduced Sulphur/Hydrogen Sulphide (TRS/H2S)

Total Hydrocarbons (THC)

Non-Methane Hydrocarbons (NMHC)

Fine Particulate Matter (PM2.5)

Ammonia (NH3)

Sulphur dioxide (SO2) – Sulphur dioxide is produced from the combustion of sulphur-containing fossil fuels. Sulphur dioxide in the air at high concentrations can make breathing difficult, particularly for children, the elderly, and people with asthma. Sulphur dioxide reacts in the atmosphere to form sulphuric acid and acidic aerosols, which contribute to acid deposition and acid rain.

Time-integrated sampling provides more detailed analysis of species present in ambient air, and supplements continuous monitoring which reports a total concentration in real-time. Time-integrated monitoring methods consist of exposing sample media to the atmosphere for a period of time, and then the media is sent to a laboratory for analysis.

The WBEA's time-integrated sampling data is available to everyone at wbea.org/network-and-data/integrated-data. The data for time-integrated monitoring methods is presented in the graphs below as the annual average (mean) of 24-hour sample concentrations, along with the 95th percentile to show readings on the high-end of the data collected, after removing the highest 5% which may be outliers. There are numerous species collected, however, the graphs show the nine (9) or ten (10) parameters with the highest concentrations in 2021.

Note: Select which parameter you would like to view, and then use the drop-down menu to select an air monitoring station.
Note: Averages may be too small to be visible on some graphs. Hover over the graph to view specific values.

Fine Particulate Matter 2.5 (PM2.5) Ions

Fine Particulate Matter 2.5 (PM2.5) Metals

Coarse Particulate Matter 10 (PM10) Ions

Coarse Particulate Matter 10 (PM10) Metals

Polycyclic Aromatic Hydrocarbons (PAHs)

Volatile Organic Compounds (VOCs)

Change the location

PM2.5 refers to particles in the fine fraction (2.5 µm in diameter or less) that are produced mainly by combustion processes and by atmospheric reactions between precursor gases such as sulphur dioxide, nitrogen oxides, ammonia and some volatile organic compounds. In the coarse fraction (between 2.5 and 10 µm in diameter), particles are mainly from re-suspended road dust, windblown dust, and material handling, grinding and crushing operations. PM10 includes both the fine and coarse fractions and is sometimes referred to as inhalable particulate matter. Particulate matter consists of a mixture of solid particles and liquid droplets found in the air. Fine particulate matter (PM2.5) is 2.5µm in diameter or less, while coarse particulate matter (PM10) is 10µm in diameter or less.

In the time-integrated sampling program, particulate matter (both PM2.5 & PM10) is collected on a filter for a 24-hour period, every six days. PM2.5 samples were collected at six community stations (Bertha Ganter-Fort McKay, Patricia McInnes, Athabasca Valley, Anzac, Janvier, and Conklin) and one industrial location (Horizon). PM10 samples were taken at the same six community stations and three industrial stations (Fort McKay South, Horizon, and Muskeg River). These filters are then sent to the lab for sample analysis to learn the chemical compositions including ionic and metal species. Ions are electrically-charged, water-soluble particles, while metals are neutral species.

The continuous analyzer can tell us the concentration of particulate matter in the air at any given time, while a time-integrated sample can tell us what is making up the composition of the particulate matter in the air.

Fungi growing on a fallen tree.

Deposition Monitoring

The Deposition Monitoring program, also referred to as the Terrestrial Environmental Effects Monitoring (TEEM) program, was established to address community, industry, and government concerns about impacts to regional forests from industrial development.

The objective of the program is to determine cause-effect relationships between air pollutants and forest ecosystem health in the region. To meet this objective the WBEA operates both a long-term Forest Health Monitoring Program and an Atmospheric Pollutant Deposition Monitoring Program which monitor stressors (acidification/eutrophication) along the pathway (atmospheric transport) from source (industrial emissions) to the receiving environment (jack pine forests).

To understand changes in regional deposition over time, data derived from the program must be integrated and analyzed every several years. The most recent comprehensive analysis of historical data was completed in 2019. At that time, the WBEA developed 75 recommendations for program improvements and also published nine open access manuscripts in a Virtual Special Issue of the journal Science of the Total Environment. The issue, entitled “Relationships Between Air Pollutants and Forest Ecosystem Health in the Oil Sands Region, AB, Canada”, is available online here.

In 2021, the WBEA initiated the next data analysis exercise, using data collected more recently, that will supplement the previous findings and continue to explore changes in deposition over time. In addition, the WBEA continued to evaluate the program recommendations and, using these lessons learned, adapt its activities to better meet the program objectives.

Ambient air monitoring infographic.
Number 1 image

Source

Pollution is emitted into the air from a variety of sources

Number 2 image

Deposit

The pollution may be deposited onto the surrounding forest

Number 3 image

Measure

The WBEA collects samples and information to measure the effects of pollution on the enviroment

Forest Health Monitoring

The Forest Health Monitoring program monitors jack pine forest sites to assess whether there are changes to biological, physical, and chemical indicators through a sampling campaign of soils and vegetation every 6-years, as well as lichen sampling at varying intervals. During initial program development, the upland jack pine (Pinus banksiana) ecosystem was identified as the most sensitive receptor to acidification due to their characteristically dry, nutrient poor soils with limited buffering capacity. In these ecosystems, the effects of acid deposition are expected to be observed in a cascading manner from soils to vegetation, first impacting individual organisms, then the stand, and onward to landscape level impacts. This concept is depicted in the critical load graph.

In 2021, two new forest health sites were established in the southern portion of the WBEA region to meet new Environmental Protection and Enhancement Act compliance conditions and to address a gap in the current network. Site establishment followed the 2018 Forest Health Monitoring Program Procedures and included soil, foliage, and lichen sampling, and tree coring.


Also in 2021, the WBEA executed the regional lichen monitoring program and collected approximately 150 lichen samples, of the species Hypogymnia physodes, from all over the region as shown on the adjacent map. This species of lichen receives its nutrients from the air and rain making it a very effective natural tool for monitoring air pollution. Data obtained from these samples is critical to the program and is used to determine changes in atmospheric deposition over time and across the regional landscape.

Forest health map
photo of wetlands in Wood Buffalo Municipality from the air

Atmospheric Pollutant Deposition Monitoring

To better understand the nature and quantity of the compounds deposited on the regional landscape, and to inform the Forest Health Monitoring program, the WBEA operates a network of air quality monitoring (using passive and active air quality samplers) and deposition monitoring sites (using ion exchange resins) in remote locations across the RMWB for evaluation of a broad set of compounds (particulate matter, organic compounds, metals). The WBEA’s deposition monitoring data is available to everyone and is searchable using the WBEA’s Time-Integrated Data Search tool, here. A list of the parameters measured at deposition monitoring sites and the available datasets can be accessed by clicking through the pop-up window, here.

Passive Air Sampling - Passive Samplers

Passive air sampling, specifically using passive samplers, is a cost-effective method for coverage of a broad spatial range, including remote locations, because they have no moving parts and require no power. The WBEA uses passive samplers to monitor sulphur dioxide (SO2), nitrogen dioxide (NO2), nitric acid (HNO3), ammonia (NH3), and ozone (O3) across the Athabasca Oil Sands Region and this data, along with meteorological data, is used to model deposition trends. In 2021, data collection was paused to allow for the validation of laboratory analytical results and a program evaluation.

Active Air Sampling – Denuders and Remote Ozone Analyzers

Active air sampling uses a pump to provide a known volume of air to a continuous analyzer or sample media. For this reason, in addition to a low detection limit, active air sampling provides higher quality data than passive air sampling, however, because they require power, they can be more costly and less versatile. In 2021, ammonia (NH3), nitric acid (HNO3), and particulate matter (PM2.5) were monitored year-round at eights sites by active sampling using a solar-powered denuder system. Ground-level ozone (O3) was monitored during the summer season at three sites with solar-powered continuous analyzers. The WBEA’s active air sampling data is available to everyone at the WBEA's Time-Integrated Data Search Tool.

Passive Deposition Sampling - Ion Exchange Resin

Ion exchange resin technology (IER) are a passive sampling technology, comprised of a column of resin beads that capture anions [ammonium (NH4+), nitrate (NO3-), phosphate (PO43-), sulfate(SO42-)] and base cations [calcium (Ca+), potassium(K+), magnesium(Mg+), and sodium(Na+)]. IERs are critical to the deposition program as they provide actual measurements of deposition which are required to validate the critical loads mapping and modeling exercises. In 2021, the WBEA collected IERs from 47 sites in the spring and fall.

Instrumented Regional Meteorological Network

The WBEA's regional meteorological network provides key data for calculating deposition rates, modeling dry deposition, and evaluating the performance of deterministic models. The network is comprised of six 30-meter instrumented towers ("met towers") and six instrumented tripods ("met tripods") that provide continuous, hourly data on climatic conditions throughout the Wood Buffalo region. Each met tower is co-located with a Forest Health Monitoring (FHM) site and monitors air temperature, relative humidity, wind speed, wind direction, and solar radiation at four levels within and above the jack pine canopy, as well as temperature and volumetric water content within forest soil. Each met tripod is positioned in natural peatland clearing adjacent to a FHM site and monitors air temperature, relative humidity, wind speed, wind direction, and solar radiation.

View tower data

The map above shows where each of the six 30-meter meteorological towers are located within the WBEA's network. The wind data collected from these towers, measured above the tree canopy, are used to characterize wind flow in a wider geographical area, calculate emission deposition, and evaluate ecological data. The corresponding wind roses for each tower are located below.

Wild berries on a bush in the forest.

Traditional Knowledge

The WBEA has fostered collaborative relationships with Indigenous communities in the Wood Buffalo region since its formation. To coordinate these partnerships, the WBEA established a Traditional Knowledge Committee (TKC) to help develop and oversee long-term, traditional knowledge-based, community monitoring programs; the focus over the past number of years has been on the Community-Led Berry Contamination Study.

The Community Led Berry Contamination Study is a multi-year community-based monitoring project that builds upon work initiated by Fort McKay First Nation, with support from the Wood Buffalo Environmental Association, since 2010. The project has grown to include Conklin Métis, Fort McKay Métis, Fort McMurray Métis, and Fort McMurray First Nation 468.

The study objective is to monitor berries from culturally significant patches to inform the community questions, including “are the berries safe to eat?” and is driven by the concerns of the participating community members about changes to berry quality and health due to oil sands-related development. The cultural identity of Indigenous peoples is intertwined with their food sovereignty and food security, therefore, the continued access to cultural keystone species of berries is paramount for community health and well-being.

In 2021, the study focused on the assessment of laboratory analytical data and lessons learned from previous monitoring years, resulting in the documentation of project design and standard operating procedures in a comprehensive Project Framework and the development of community-specific technical reports summarizing results. Gatherings were held by each participating community where these results were shared.

The study has produced qualitative and quantitative data for each community that has provided meaningful insight on their berry condition. While the WBEA provides support to the communities, the WBEA does not share the data on the communities’ behalf; however, there is some indication from this project that levels of contaminants of concern are elevated in berries from patches considered unclean by Indigenous members, which are located closer to oil sands development, versus berries from patches considered clean or sacred by Indigenous members, which are located farther away from development.

Going forward, the study will continue to use best practice methodologies that appropriately braid Indigenous and Western knowledge systems to build trusted relationships between participating Indigenous communities, academic researchers, and provincial and federal government scientists.

Sunset over forest

Odour Monitoring

Community Odour Monitoring Program

The WBEA created the Community Odour Monitoring Program (COMP) app as an opportunity for people to provide information about the odours they experience throughout the RMWB, as outlined in the image below. Currently, analyzers can measure the concentration of specific pollutants or groups of pollutants, but they cannot measure if an odour is present or how strong the odour would be. Therefore, the app allows the WBEA to compare the information people provide about odours to the ambient air data collected at WBEA air monitoring stations. The intent is to find whether there are trends in the ambient data when odours are present—such as elevated concentrations of odour-causing compounds. Observations are displayed in near-real time on the COMP website.

For more information about the COMP, the 2021 COMP Annual Report, as well as links to download the app on iOS and Android devices visit comp.wbea.org.

Download the COMP App

for free on the App Store or Google Play and anonymously share odour event observations with the WBEA.

iOS Devices Android Devices
Community Odour Monitoring Program infographic.
Number 1 image

Source

Pollution is emitted into the air from a variety of sources

Number 2 image

Smell

The pollution may cause odours - anyone who experiences an odour in the RMWB can submit their observations via the WBEA’s COMP app

Number 3 image

Share

Users can learn about odours and view all observations submitted at comp.wbea.org

WBEA app modelled on a phone

Comp needs YOU!

The Community Odour Monitoring Program is still going on. To participate and provide information on the odours you experience in the Regional Municipality of Wood Buffalo:

1

Download the COMP App for iPhone or for Android devices

2

When you smell an odour in the air, submit an observation in the App

The information collected is anonymous and will be used for research purposes only.

WBEA 2021 Membership

INDIGENOUS MEMBERS

Athabasca Chipewyan First Nation
Chipewyan Prairie Dene First Nation
Christina River Dene Nation Council
Conklin Resource Development Advisory Committee
Fort McKay First Nation
Fort McMurray #468 First Nation
Fort McKay Métis Nation
Lakeland Métis Community Association
McMurray Métis
Mikisew Cree First Nation

GOVERNMENT MEMBERS

Alberta Energy Regulator
Alberta Environment and Parks
Alberta Health
Alberta Health Services
Environment and Climate Change Canada
Health Canada
Parks Canada
Regional Municipality of Wood Buffalo

NON-GOVERNMENT ORGANIZATION MEMBERS

Pembina Institute
Keyano College

INDUSTRY MEMBERS

Athabasca Oil Corporation
Canadian Natural
Cenovus Energy Inc.
CNOOC International
Connacher Oil and Gas Ltd
ConocoPhillips Canada
Hammerstone Infrastructure Materials Ltd.
H.J. Baker Sulphur Canada ULC
Husky Oil Operations Ltd.
Imperial Oil Limited
Inter Pipeline Limited
MEG Energy Corp.
Parsons Creek Aggregates
PetroChina Canada Ltd.
Suncor Energy Inc.
Sunshine Oilsands Ltd.
Surmont Energy
Syncrude Canada Ltd.
Teck Resources Ltd.
Titan Tire Reclamation Corporation

Tree line.

Downloadable PDF of Annual Report

Download