


Overview
Ambient Air Monitoring

In 2023, the WBEA focused its efforts on meaningful engagement with its membership and committees to further the understanding of WBEA programs and initiatives.
This effort could be seen in action among members of the Network Assessment Working Group (NAWG). The group found serious traction in 2023, finalizing recommendations which were proposed to optimize and enhance our current monitoring network.
The re-engagement of the Traditional Knowledge Committee (TKC) was another notable highlight for the year. The WBEA respects Indigenous ways of knowing in all parts of the work we do. The TKC met three times in 2023, ending the year by re-establishing the committee’s purpose, goals, and direction which will lay the groundwork for 2024 and beyond.
Knowledge sharing was further prioritized in the WBEA’s Forest Health Monitoring (FHM) workshops. An extension of the longstanding Terrestrial Environmental Effects Monitoring (TEEM) Committee, these workshops aimed to grow understanding and support for FHM program efforts from stakeholders, partners, and Indigenous community members alike.
Through every success the WBEA achieved in 2023, we worked to demonstrate a commitment to our vision, mission, and values.
The information found in this report is the result of the collaborative work of all WBEA staff, members, stakeholders, and rightsholders coming together in understanding the important role that high-quality environmental monitoring continues to play in our region.
The WBEA has had a long-standing presence in the region having originally formed as an Air Quality Task Force in 1985. The WBEA was officially incorporated in 1997 and has been the leader in air quality monitoring in the region ever since. For a better understanding of the WBEA’s history and governance structure, please visit the “About” section of our website, wbea.org.
To empower all stakeholders and rightsholders with environmental data to make informed decisions.
We are a multi-stakeholder, consensus-based organization providing world-class environmental monitoring and reporting.
The General Members Board and Governance Committee provide strategic direction and oversight for the organization. The Technical Committees determine the strategic plans and direction for each of the WBEA's monitoring programs. The Executive Director provides operational direction for the WBEA staff, engaging science and technical advisors as required, to ensure stewardship to the overarching direction set by the General Members Board and Governance Committee.
The WBEA is fortunate to work with partners across the province, including Alberta Environment and Protected Areas, the Oil Sands Monitoring Program, and Alberta Airsheds Council. The WBEA acknowledges the financial support of the AEPA and the Oil Sands Monitoring Program. To learn more about the WBEA's involvement with these partnerships, visit:
WBEA PartnershipsThe WBEA and its monitoring network serve the RMWB, a region situated within the boreal forest of northwestern Alberta. The interactive map belowon the right shows each location of the WBEA’s monitoring sites in 2023.
 All Stations
 WBEA Boundary
Ambient Air Monitoring
 Ambient Air - Continuous Sites
 Regional Meteorology Towers
Deposition & Effects Monitoring
 Forest Health Sites
 Ion Exchange Resin Sites
 Denuder Sites
 Passive Sites
This map shows the locations for all monitoring stations in 2023 within the WBEA monitoring network.
For more information on these stations, please visit wbea.org/network-and-data/monitoring-stations.
Overview
Ambient Air Monitoring
Overview
Deposition and Effects Monitoring
Overview
Odour Monitoring
Overview
Community-Based
Monitoring

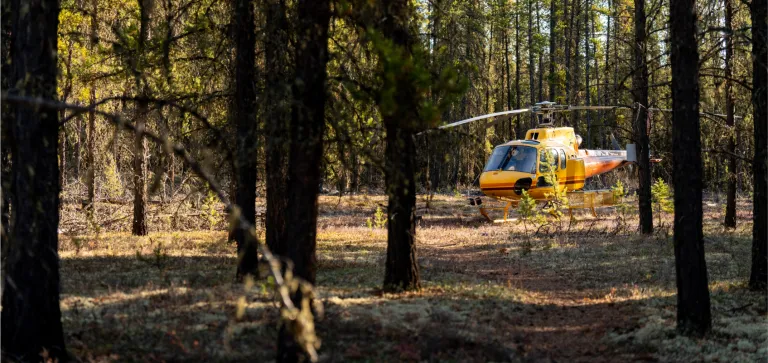
The WBEA operated approximately 30 ambient air monitoring stations (AMS) throughout the RMWB in 2023. These included industrial, attribution, community, background, and meteorological stations.
The Ambient Air Monitoring (AAM) Program functions to address multiple objectives, scientific questions, and requirements set by global, national, provincial, and regional jurisdictions. The WBEA’s website highlights each of these requirements specifically and how they relate to the WBEA’s monitoring network activities.
When ambient concentrations of any air pollutant the WBEA measures exceed the Alberta Ambient Air Quality Objectives and Guidelines (AAAQOs & AAAQGs), which are set provincially, the WBEA has an Immediate Reporting Protocol that is put into action.
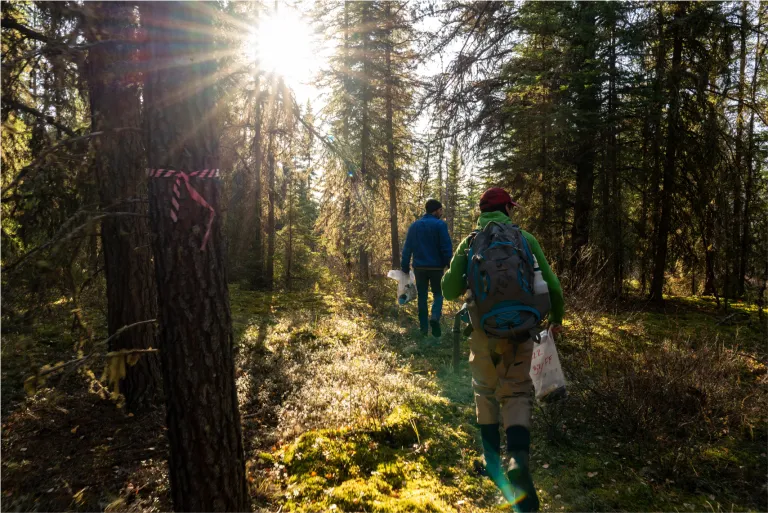
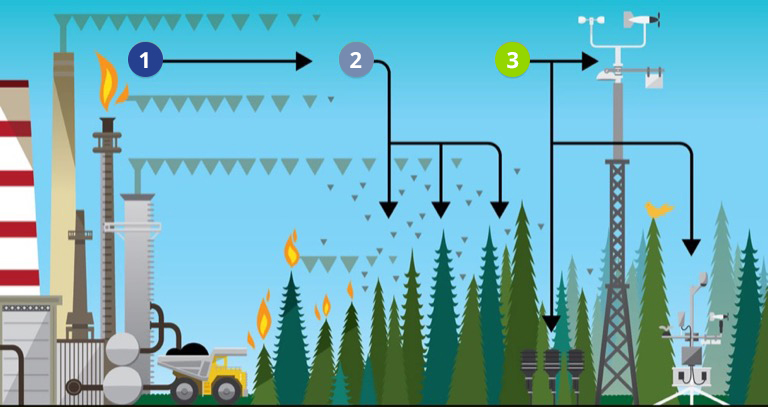
Pollution is emitted into the air from a variety of sources.
The WBEA ambient air monitoring stations measure the concentrations of pollutants in the air.
The information the WBEA collects is available to view and is used to calculate the air quality health index (AQHI).
Alberta’s Air Quality Health Index—AQHI—is a scale created to help individuals better understand the impact of air quality on their health by providing important ambient air data at a glance. The graphs below show the percentage of time each community station reported each risk level during 2023.
Low Risk 88.40%
Moderate Risk 6.21%
High Risk 3.67%
Very High Risk 1.71%
Low Risk 87.46%
Moderate Risk 7.50%
High Risk 3.33%
Very High Risk 1.70%
Low Risk 83.27%
Moderate Risk 7.17%
High Risk 6.29%
Very High Risk 3.27%
Low Risk 83.58%
Moderate Risk 8.29%
High Risk 5.63%
Very High Risk 2.49%
Low Risk 84.47%
Moderate Risk 8.38%
High Risk 4.78%
Very High Risk 2.38%
Low Risk 84.76%
Moderate Risk 9.09%
High Risk 3.89%
Very High Risk 2.26%
Low Risk 85.03%
Moderate Risk 9.14%
High Risk 3.59%
Very High Risk 2.24%
Low Risk 88.48%
Moderate Risk 6.32%
High Risk 3.37%
Very High Risk 1.83%
The WBEA’s ambient air quality data is compared to several established air quality thresholds, triggers, and limits. Air Quality Events represent a deviation from standards set as the Alberta Ambient Air Quality Objectives (AAAQO), and indicators identified as the Alberta Ambient Air Quality Guidelines (AAAQG). When an exceedance occurs, the WBEA follows the guidance of the Air Monitoring Directive and reports each occurrence to the appropriate governing bodies.
The WBEA developed an Air Quality Events (AQE) app as another way to notify interested stakeholders and partners of air quality events related to AAAQOs and AAAQGs. The AQE app provides near-real time notifications when an exceedance occurs in the network and allows users to subscribe to air monitoring stations of interest. The app is available for download on iOS devices. In addition, all the historical and near real-time air quality events information are stored on the Air Quality Events page of the WBEA website.
The first graph below presents a total count of air quality exceedances at all WBEA ambient air monitoring stations over a five-year period for AAAQOs and AAAQGs from 2019-2023. The second graph shows the exceedances for 2023 based on station locations.
NOTE: Values may be too small to be visible on some graphs. Hover over the graph to view specific values.
Note: Forest fire season was considered to be from March 1 – October 31, 2023.
Note: TSP data reporting began in September 2022. Dustfall data reporting began in November 2022.
Note: Forest fire season was considered to be from March 1 – October 31, 2023.
The Lower Athabasca Regional Plan (LARP) has existed as an extension of the Alberta Land-Use Framework since September 2012.
The LARP air quality objective is to manage releases from multiple sources, so they do not collectively result in unacceptable air quality. The LARP sets out trigger levels and limits for NO2 and SO2 as described in the table below. The WBEA provides AEPA with the air quality data that is used to calculate the annual LARP triggers and limits. When a trigger is exceeded, AEPA is required to create a regional management response.
The following graphs show the annual average and hourly 99th percentile concentrations of NO2 and SO2 at each station location compared to the respective triggers and limit for each parameter. The use of the hourly 99th percentile data is a statistical measure to indicate upper limits of the data. Increases in the 99th percentile beyond the LARP triggers can be an early warning to help inform appropriate management actions to prevent future exceedances.
Learn more about LARPMeteorological parameters, including wind speed and direction, humidity, precipitation, atmospheric pressure, solar radiation, and the vertical temperature structure of the atmosphere, all impact the dispersion, deposition, and transformation of common air pollutants.
Wind rose plots provide visual context for the speed, direction, and frequency of winds, and are shown below for each WBEA community station in the network. The colours within each wind rose triangle denote the frequency of the wind speed (shown in the legend above the wind roses). Calms are shown for each station as a percentage of time that wind speeds are below 0.5 kilometers per hour (km/h).
An example of how to read a wind rose plot: the largest triangle in Fort Chipewyan wind rose shows the wind comes from the East, about 20% of the time in 2023. The olive-green colour in this triangle shows the wind was between 10 and 15 km/h about 4% of the time. Wind speeds were less than 0.5 km/h in Fort Chipewyan 0.06% of the time (calms).

WIND SPEED (km/h)
Calms: 0.07%
Tower Height: 20m
0.5 - 5
5 - 10
10 - 15
15 - 20
20 - 25
>= 25

Two key sampling methods are used by the WBEA for conducting high quality ambient air monitoring within its network: continuous, which generates raw air quality data in near real-time, and time-integrated or “non-continuous”.
View parametersThe graphs below provide an overview of each parameter measured, including its sampling method, in 2023.
As its title suggests, the WBEA’s continuous ambient air monitoring uses analyzers that continually measure concentrations of pollutants in the air. This data is readily available to anyone in near real-time on our website, wbea.org.
In addition to specific compounds, all stations continuously measure temperature, relative humidity, and wind speed and direction.
The data for continuous monitoring is presented in the following graphs as the annual hourly average (mean) concentrations of each parameter, along with the annual hourly 99th percentile and maximum concentrations. Please note, the averages may be too small to be visible on some graphs. The annual hourly 99th percentile is used to show the high end of concentrations measured at the WBEA air monitoring stations, after removing the highest 1% of events which may be outliers.
Note: Averages may be too small to be visible on some graphs. Hover over the graph to view specific values.
** Note: The WBEA uses Portable Air Monitoring Stations to measure air quality in locations where a permanent air monitoring station does not exist. Based on regulatory requirements, ambient air quality monitoring may be required for 3, 6, or 12 months per year.
Sulphur dioxide (SO2) – SO2 is produced from the combustion of sulphur-containing fossil fuels. Sulphur dioxide in the air at high concentrations can make breathing difficult, particularly for children, the elderly, and people with asthma. SO2 reacts in the atmosphere to form sulphuric acid and acidic aerosols, which contribute to acid deposition and acid rain.
Time-integrated sampling provides a more detailed analysis of species present in ambient air, and supplements continuous monitoring which reports a total concentration in real-time. Time-integrated monitoring methods consist of exposing sample media to the atmosphere for a period of time, then collecting and sending that media to a laboratory for analysis.
The WBEA's time-integrated sampling data is available at https://wbea.org/data/time-integrated-data-search/. The data for time-integrated monitoring methods is presented in the graphs below as the annual average (mean) of 24-hour sample concentrations, along with the 95th percentile to show readings on the high-end of the data collected, after removing the highest 5% which may be outliers. There are numerous species collected, however, the graphs show the nine (9) or ten (10) parameters with the highest concentrations in 2023.
Note: Select which parameter you would like to view, and then use the drop-down menu to select an air monitoring station.
Note: Averages may be too small to be visible on some graphs. Hover over the graph to view specific values.
Note: Forest fire season was considered to be from March 1 – October 31, 2023.
Particulate matter less than 2.5 µm - Ions - Particulate matter consists of a mixture of solid particles and aerosols found in the air. PM2.5 is the fraction of total particulate that are 2.5 μm (microns) in diameter or less, and is produced mainly by combustion processes, including forest fires.
Typically, exceedances of the PM2.5 AAAQO in the WBEA network are a result of forest fires. Fine particles are composed primarily of sulphate, nitrate, ammonium, inorganic and organic carbon compounds, and heavy metals. PM2.5 poses a health risk as the particles can be inhaled deep into the lungs.
The continuous analyzer measures the concentration of particulate matter in the air at any given time. A time-integrated PM2.5 sample is a measure of dry deposition and is analyzed for major ions similar to the wet deposition samples, and metals that make up the particulate matter in the air.
The Deposition Monitoring Program, also referred to as the Terrestrial Environmental Effects Monitoring (TEEM) Program, was established to address community, industry, and government concerns about impacts of industrial development to regional forests.
The objective of the program is to determine cause-effect relationships between air pollutants and forest ecosystem health in the region. To meet this objective, the WBEA operates both a long-term Forest Health Monitoring Program and an Atmospheric Pollutant Deposition Monitoring Program. These programs monitor stressors (air pollution and deposition) and the potential impacts on the receiving environment (jack pine forests).
Data derived from the program must be thoroughly integrated and analyzed. The most recent comprehensive analysis of historical data was completed in 2019. At that time, the WBEA developed 75 recommendations for program improvements and published nine open-access manuscripts in a Virtual Special Issue of the journal Science of the Total Environment. The WBEA is in the process of reviewing and updating the program to be adaptive to current developments and the needs of its members.
Pollution is emitted into the air from a variety of sources.
The pollution may be deposited onto the surrounding forest.
The WBEA collects samples and information to measure the effect of pollution on the enviroment.
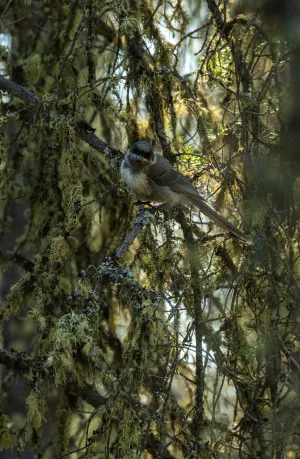
The Forest Health Monitoring (FHM) Program monitors jack pine forest sites through sampling of soils and vegetation every six years, as well as lichen sampling at varying intervals.
During initial program development, the upland jack pine (Pinus banksiana) ecosystem was identified as the most sensitive receptor to acidification due to their characteristically dry, nutrient-poor soils with limited buffering capacity. In these ecosystems, the effects of acid deposition are expected to be observed in a cascading manner from soils to vegetation, first impacting individual organisms, then the tree stand, and onward to landscape-level impacts. The bigger impacts will take a longer time to occur but will be harder to correct. This concept can be seen in the Critical Load Graph.
In 2023, the WBEA began a workshop series with the goal of information sharing and improved understanding of the FHM Program by all WBEA members. A multi-day workshop took place in November 2023, which informed members of the program’s history and key findings. The workshop also served to initiate discussions for future monitoring priorities ensuring adaptive program evolution.
In 2023, the WBEA began a workshop series with the goal of information sharing and improved understanding of the FHM Program by all WBEA members. A multi-day workshop took place in November 2023, which informed members of the program’s history and key findings. The workshop also served to initiate discussions for future monitoring priorities ensuring adaptive program evolution.
Passive air sampling, specifically using passive samplers, is a cost-effective method for coverage of a broad spatial range, including remote locations, because they have no moving parts and require no power. Passive sampler data, along with meteorological data, is used to model deposition trends. In 2023, the passive sampling program was re-established with samplers deployed at denuder sites. Parameters measured included Nitrogen Dioxide (NO2), Ozone (O3), and Sulphur Dioxide (SO2).
Active air sampling uses a pump to provide a known volume of air to a continuous analyzer or sample media. For this reason, in addition to a low detection limit, active air sampling provides higher quality data than passive air sampling. In 2023, the denuder program expanded to improve coverage across the region, growing from eight to twelve site locations.
Ion exchange resin (IER) is a passive sampling method. Each IER is comprised of a column of resin beads that capture anions (total nitrogen and sulphur) and base cations. IER data provides insight about spatial gradients of atmospheric deposition and validates critical loads mapping and modelling exercises. In 2023 the WBEA optimized the program to include an increase in base cation collection. The change came about due to data suggesting base cations play a greater role in deposition than was first anticipated, and thus required a more comprehensive sampling network.
The WBEA's regional meteorological network provides key data for calculating deposition rates, modelling dry deposition, and evaluating the performance of deterministic models. The network is comprised of six 30-meter instrumented towers ("met towers") that provide continuous, hourly data on climatic conditions throughout the Wood Buffalo region. Each met tower is co-located with a Forest Health Monitoring (FHM) site and monitors air temperature, relative humidity, wind speed, wind direction, and solar radiation at four levels within and above the jack pine canopy, as well as temperature and volumetric water content within forest soil.
The interactive map belowon the left shows where each of the six 30-meter meteorological towers are located within the WBEA's network. The wind data collected from these towers, measured above the tree canopy, are used to characterize wind flow in a wider geographical area, calculate emission deposition, and evaluate ecological data. The corresponding wind roses for each tower are located below.
0.5 - 5
5 - 10
10 - 15
15 - 20
20 - 25
>= 25
Average yearly data is displayed by default. Select the left or right arrows to view seasonal data.
Fostering collaborative relationships with Indigenous communities in the Wood Buffalo region is foundational to the work carried out by the WBEA.
The re-engagement of the Traditional Knowledge Committee (TKC) demonstrates the WBEA’s commitment to respecting Indigenous ways of knowing. The TKC was dedicated to developing a Terms of Reference (TOR) that described the intent, roles, and responsibilities of the committee. The committee’s purpose will be to reflect Indigenous perspectives in the WBEA’s monitoring programs.
In 2023, as with previous years, the Community-Led Berry Contamination Study strived to use best practice methodologies that appropriately bring together Indigenous and Western knowledge systems to build trusted relationships between participating Indigenous communities, academic researchers, and provincial and federal government scientists. Participating communities continued monitoring with a visit to each berry patch to spend time on the land, share lived experience and knowledge, observe the environmental condition, and harvest berries for laboratory analysis of health compounds and contaminants.
The Community-Led Berry Contamination Study is a multi-year community-based monitoring project that builds upon work initiated by Fort McKay First Nation, with support from the Wood Buffalo Environmental Association, since 2010. The project has grown to include Conklin Métis, Fort McKay Métis Nation, McMurray Métis, and Fort McMurray 468 First Nation.
The study objective is to monitor berries from culturally significant patches to inform the community questions, including “are the berries safe to eat?” and is driven by the concerns of the participating community members about changes to berry quality and health due to oil sands-related development. The cultural identity of Indigenous peoples is intertwined with their food sovereignty and food security, therefore, the continued access to cultural keystone species of berries is paramount for community health and well-being.
The study has produced qualitative and quantitative data for each community that has provided meaningful insight into their berry condition. While the WBEA provides support to the communities, the WBEA does not share the data on the communities’ behalf; however, there is some indication from this study that levels of contaminants of concern are elevated in berries from patches considered unclean by Indigenous members, which are located closer to oil sands development, versus berries from patches considered clean or sacred by Indigenous members, which are located farther away from development.
The Community Odour Monitoring Program (COMP) app was created as an opportunity for people to provide information about the odours they experience throughout the RMWB, as outlined in the image below. Currently, analyzers can measure the concentration of specific pollutants or groups of pollutants, but they cannot measure if an odour is present or how strong the odour would be. The app allows the WBEA to compare information people provide about odours to the ambient air data collected at WBEA air monitoring stations. The intent is to find whether there are trends in the ambient data when odours are present—such as elevated concentrations of odour-causing compounds.
Download the free COMP app to anonymously share odour observations with the WBEA:
For more information on odours in Wood Buffalo, stay informed with real-time data and community observations from the WBEA's Community Odour Monitoring Program.
COMP Website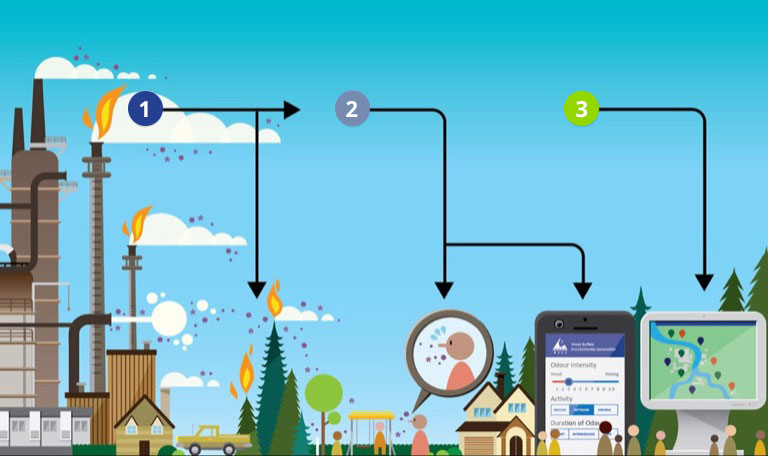
Pollution is emitted into the air from a variety of sources.
The pollution may cause odours - anyone who experiences an odour in the RMWB can submit their observations via the WBEA’s COMP app.
Users can learn about odours and view all observations submitted at comp.wbea.org.
Athabasca Chipewyan First Nation
Chipewyan Prairie Dene First Nation
Christina River Dene Nation Council
Conklin Resource Development Advisory Committee
Fort McMurray 468 First Nation
Lakeland Métis