To empower all stakeholders and rights holders with environmental data to make informed decisions.
We are a multi-stakeholder, consensus-based organization providing world-class environmental monitoring and reporting.
The WBEA had a successful and productive 2025, marked by a smooth leadership transition, steady growth, and strong collaboration. Working closely with partners and using a consensus-based approach to decision-making, the WBEA enhanced its monitoring network and improved governance and engagement by responding to community priorities and regional environmental concerns.
In January 2025, WBEA incorporated the Blackrod Air Monitoring Station into its Ambient Air Monitoring Network, increasing coverage and enabling a broader understanding of air quality in northeastern Alberta.
Governance of the WBEA’s Odour Monitoring Program (OMP) also evolved in 2025. Oversight responsibilities transitioned from the OMP Committee to the Ambient Air Technical Committee (AATC), one of the WBEA’s longest-standing committees. While governance structures changed, the WBEA understands that odours remain a concern in the region and continues to provide effective monitoring for communities and stakeholders.
The WBEA’s commitment to its members and all regional stakeholders was at the core of a boundary evaluation process undertaken in 2025.
This work was the result of collaboration among representatives from industry, Indigenous communities, and WBEA Technical Committees. The updated, expanded boundary was approved in late 2025 for implementation at the beginning of 2026. The decision reflects shared input aimed at ensuring the airshed remains scientifically sound and regionally relevant.
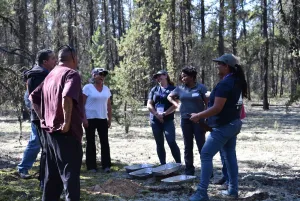
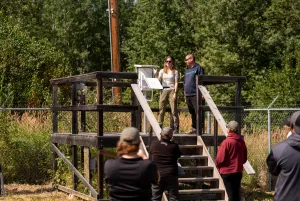
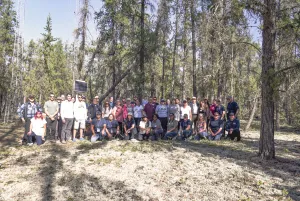
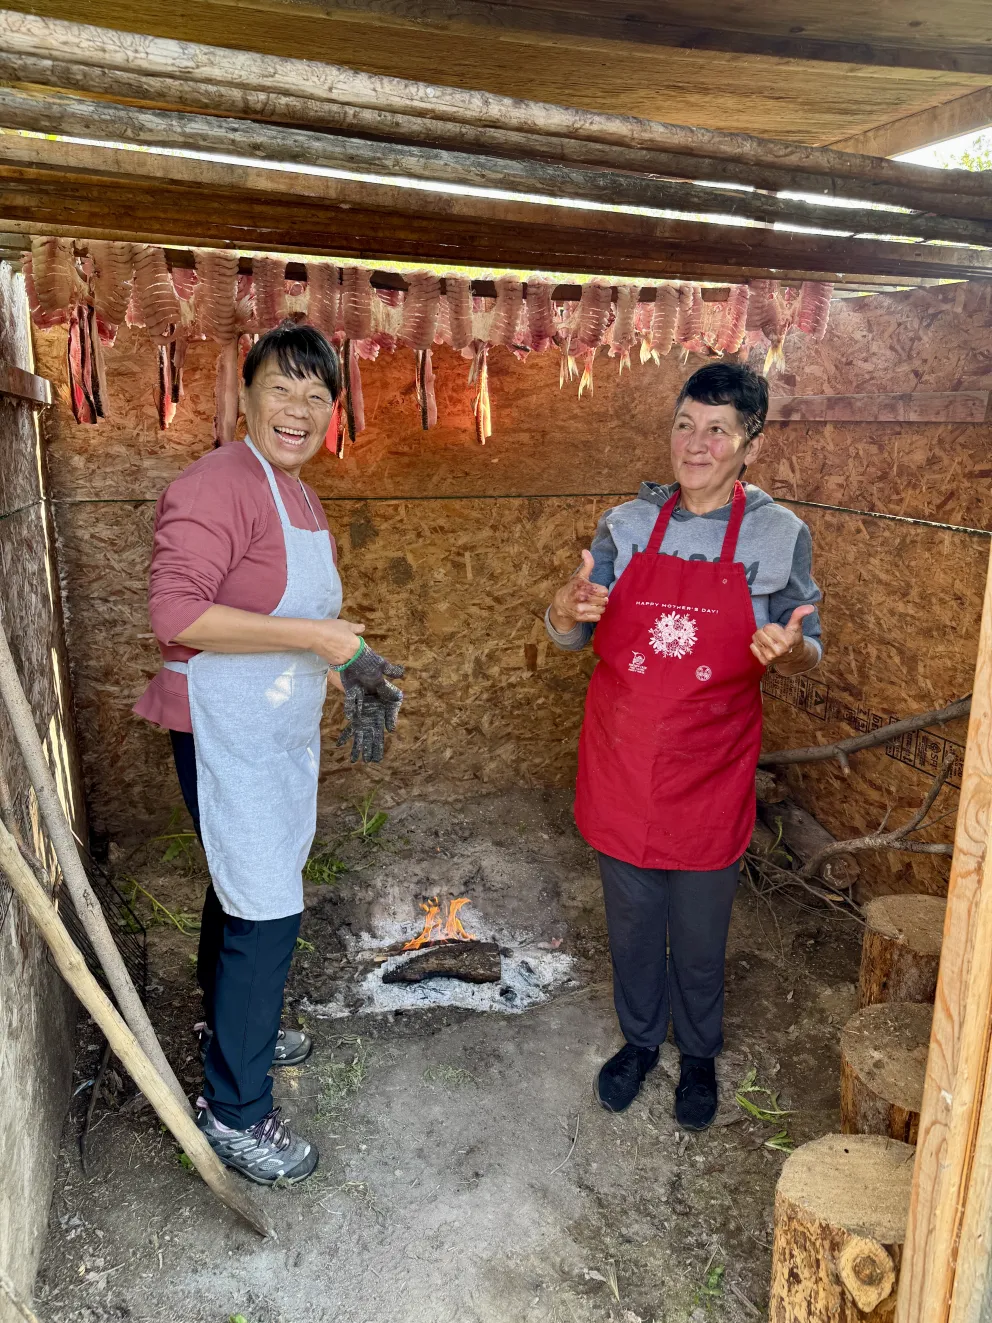
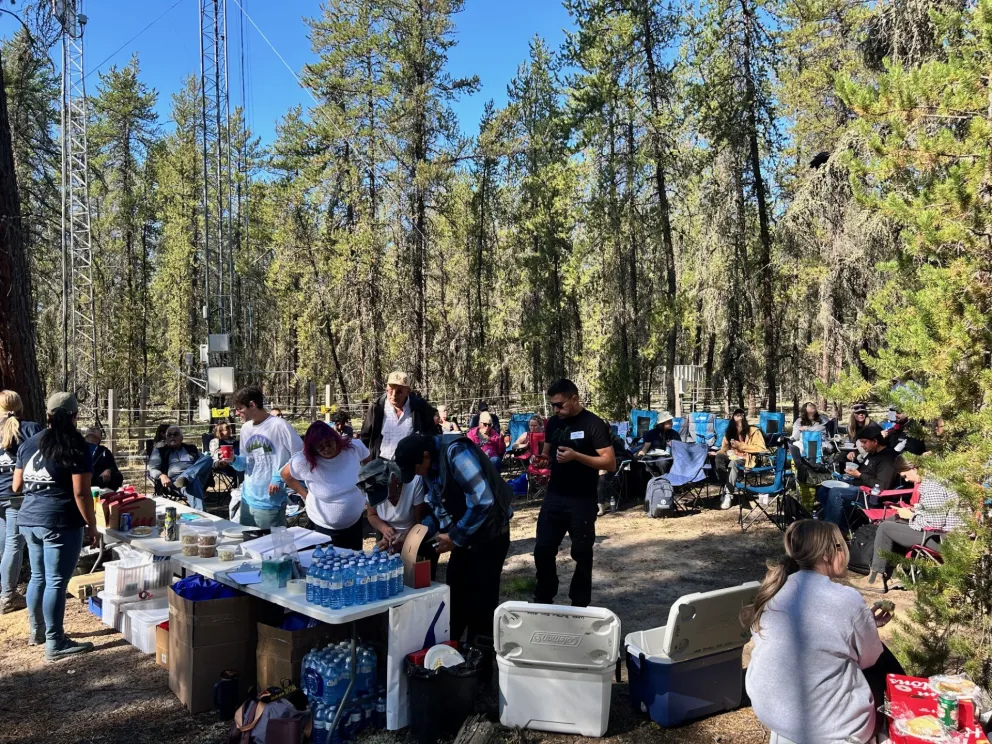
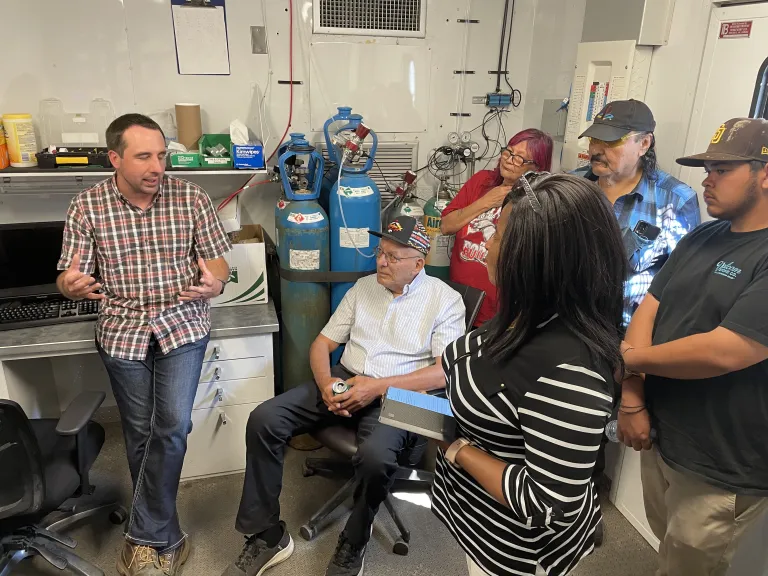
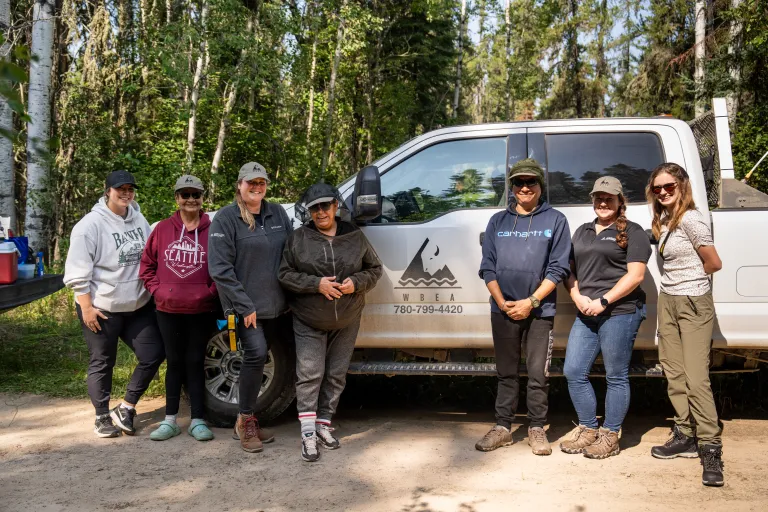
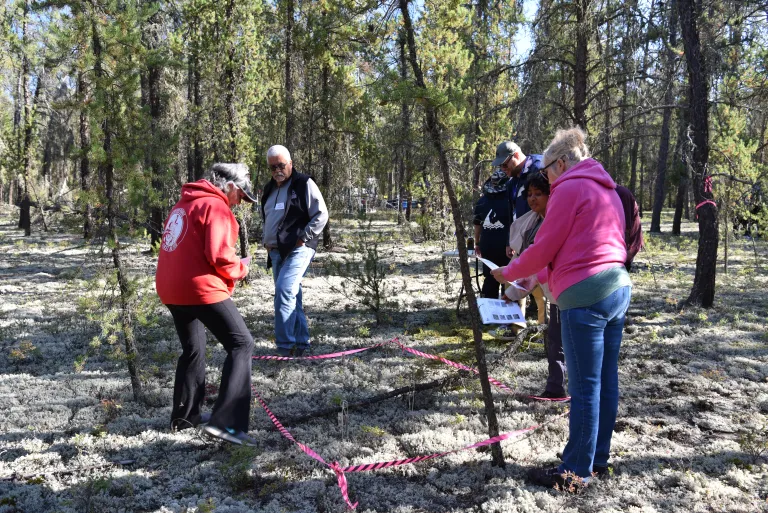
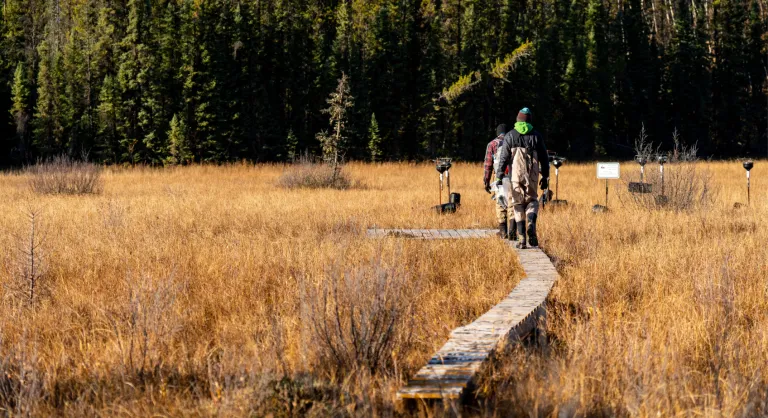
Engagement and learning were central to the Forest Health Monitoring (FHM) Program workshops, which continued in 2025. In September, the WBEA hosted a Forest Health Monitoring Field Workshop, which received positive feedback from all participants. The workshop provided hands-on, outdoor learning opportunities designed to build a stronger understanding of program measurements, share findings, and demonstrate the value of field-based monitoring.
The workshop supported continued dialogue with members, allowing space to discuss results, gather input, and explore ways to further improve the program. The workshop additionally encouraged in-person participation and strengthened connections between field activities and committee work.
The WBEA welcomed three new members in 2025: Fort Chipewyan Métis Nation, Willow Lake Métis Nation, and Lac La Biche County.
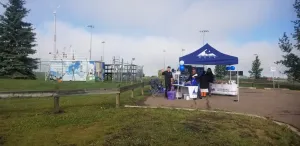
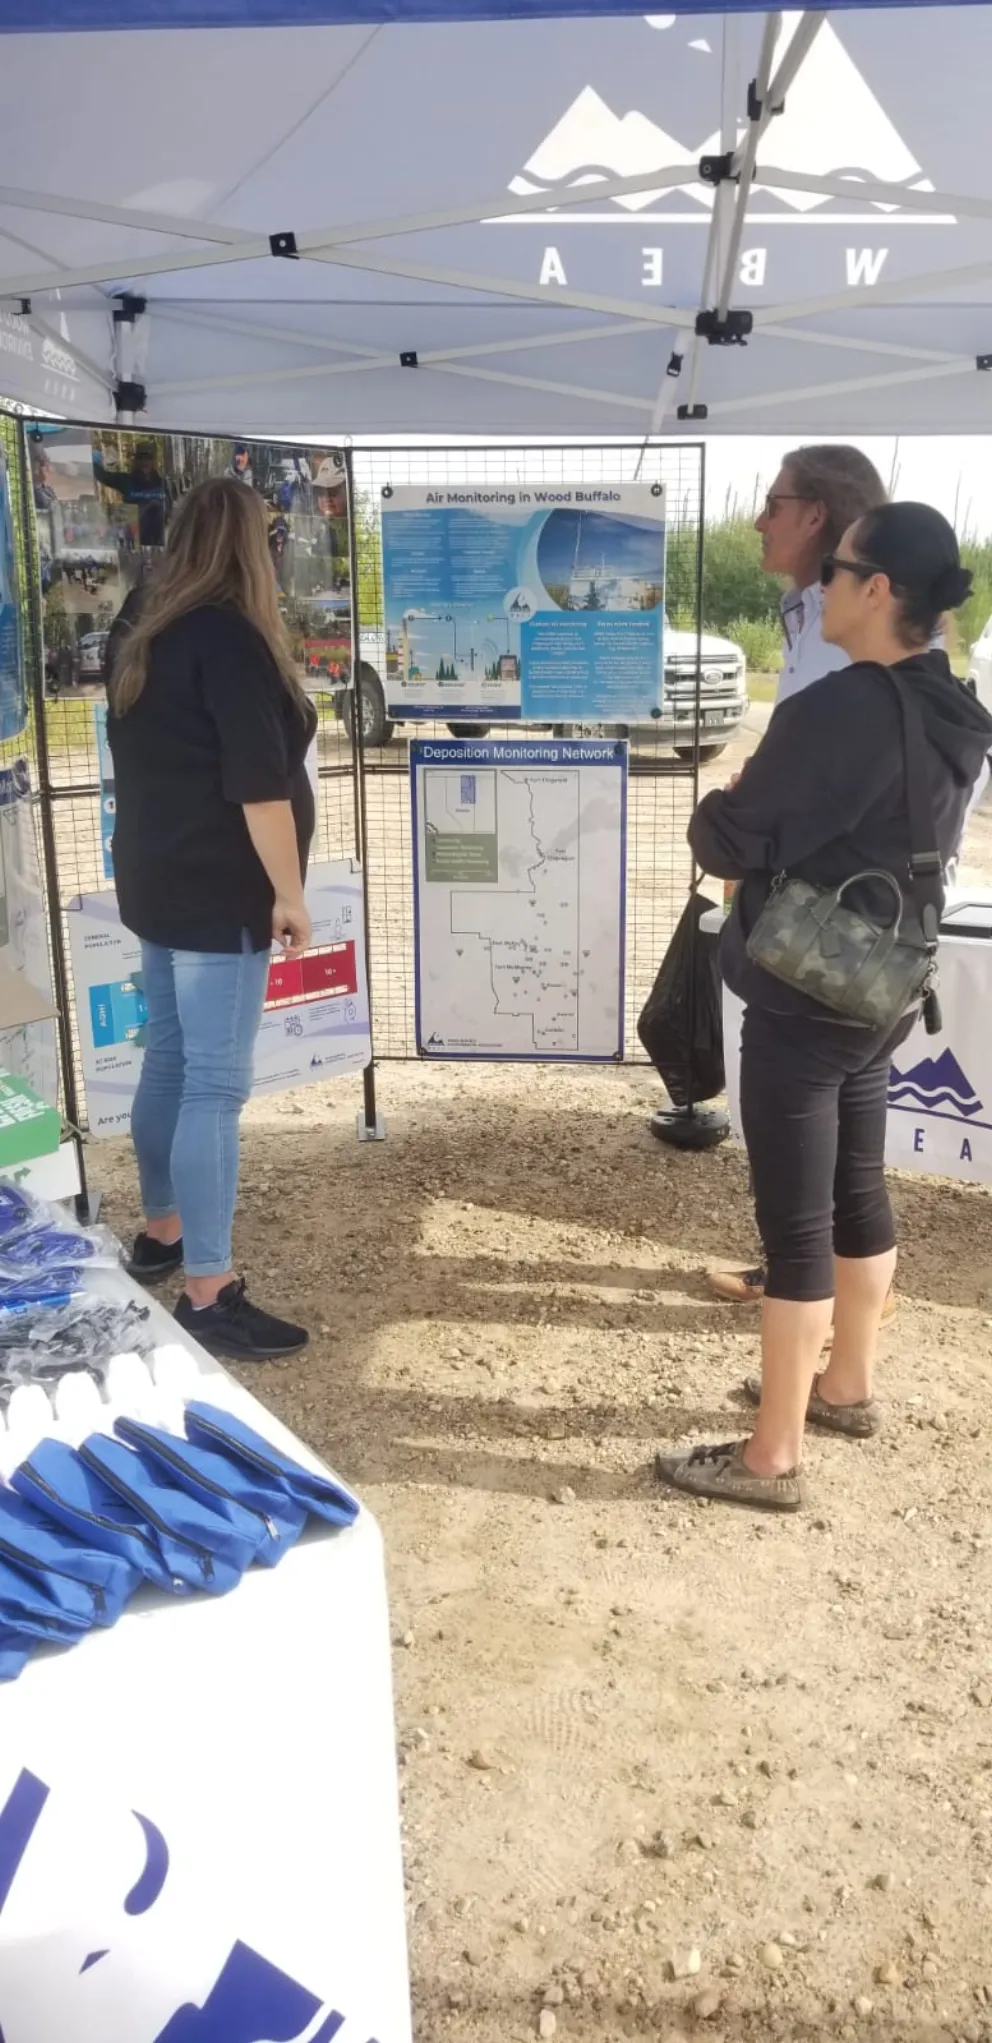
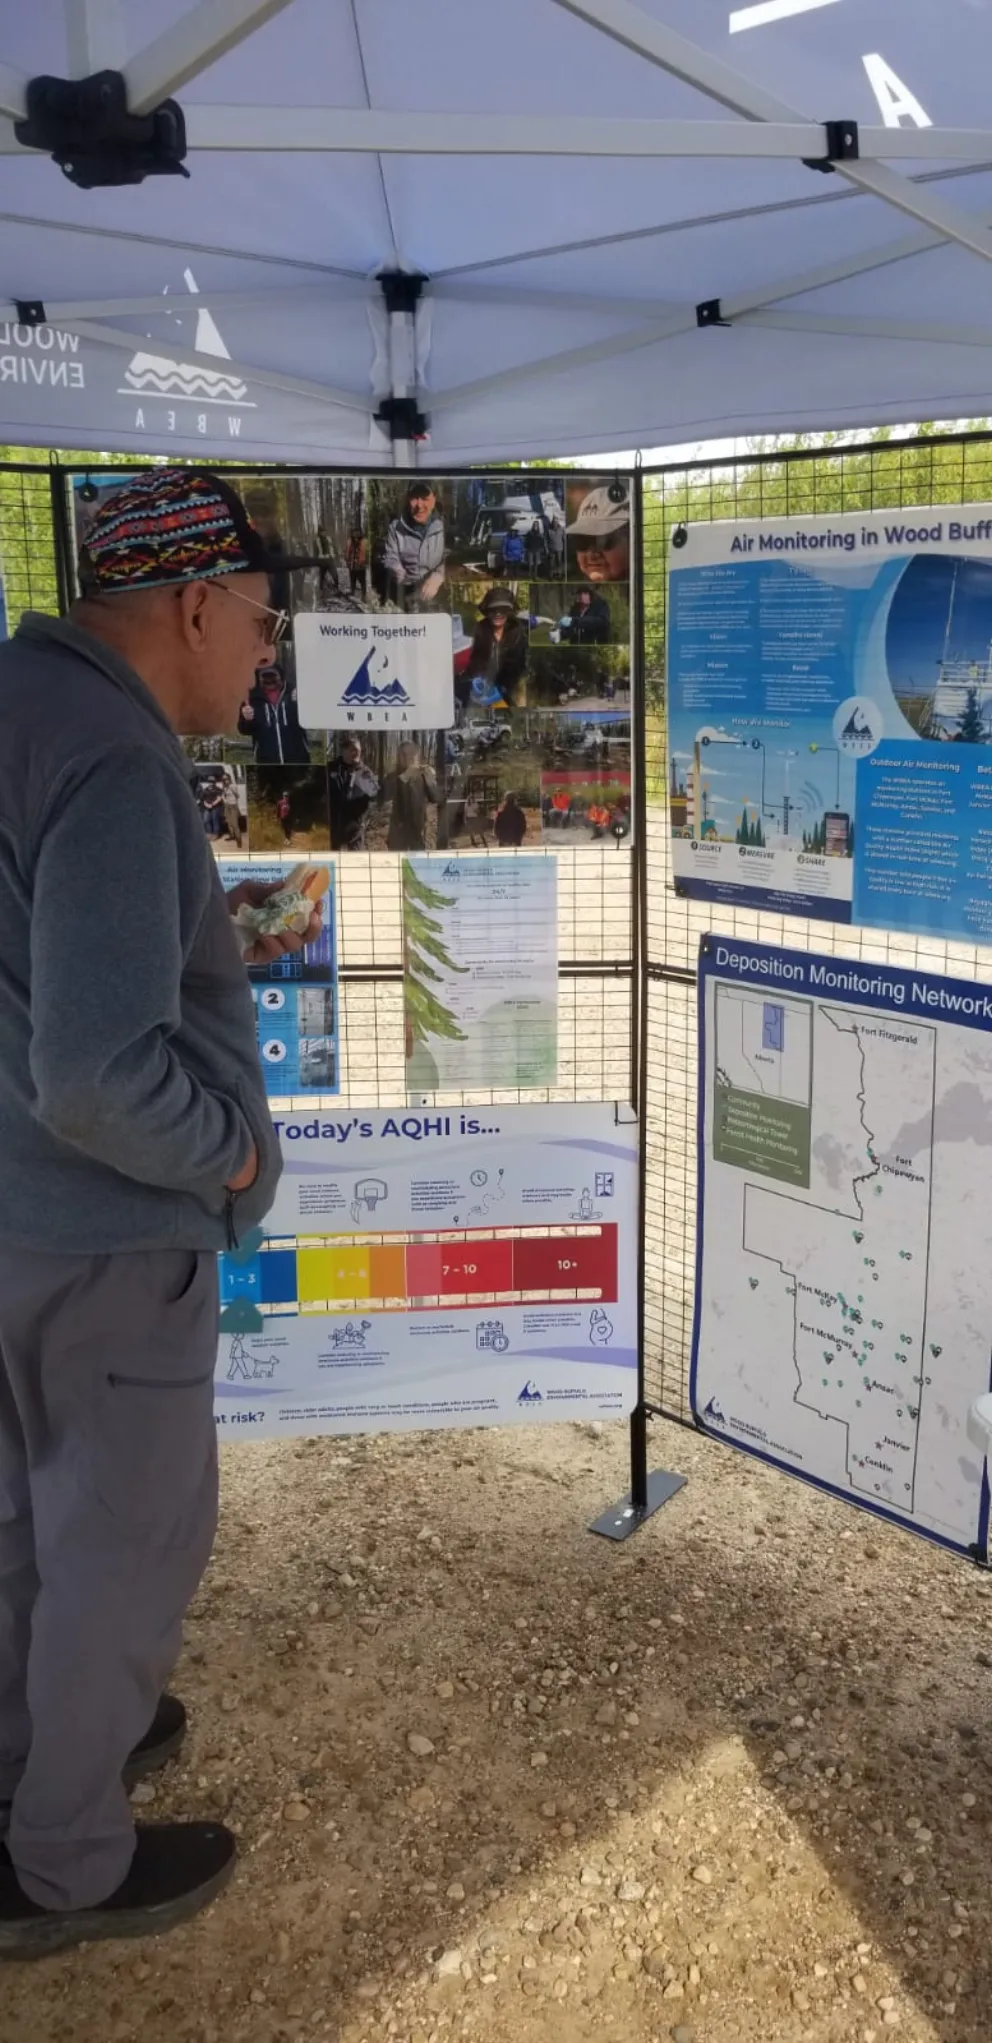
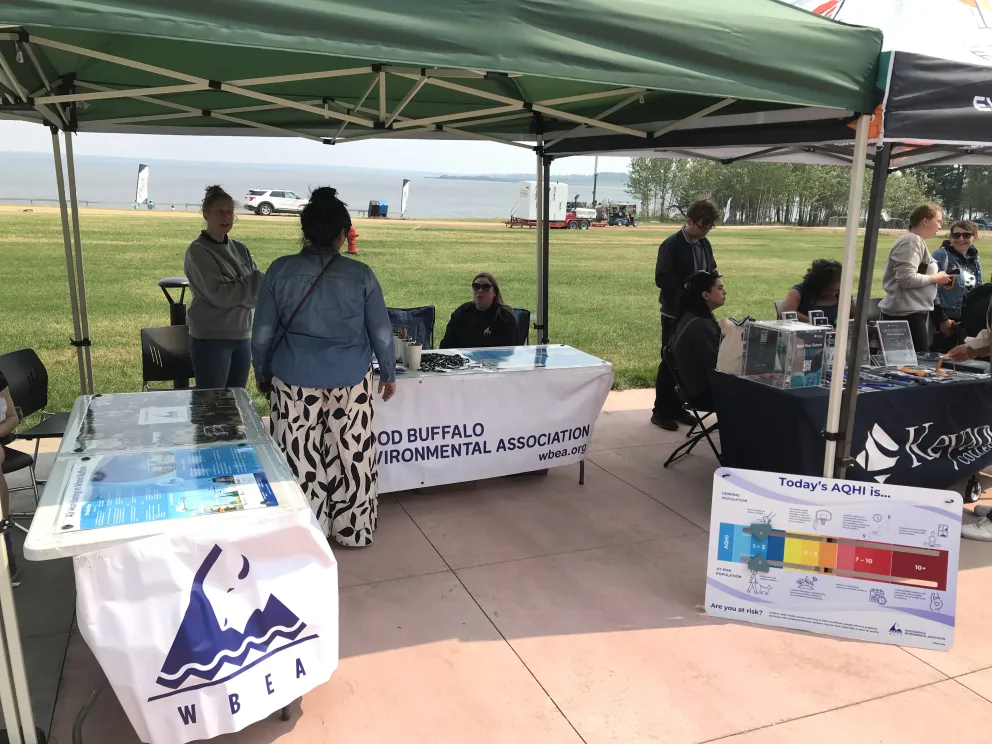
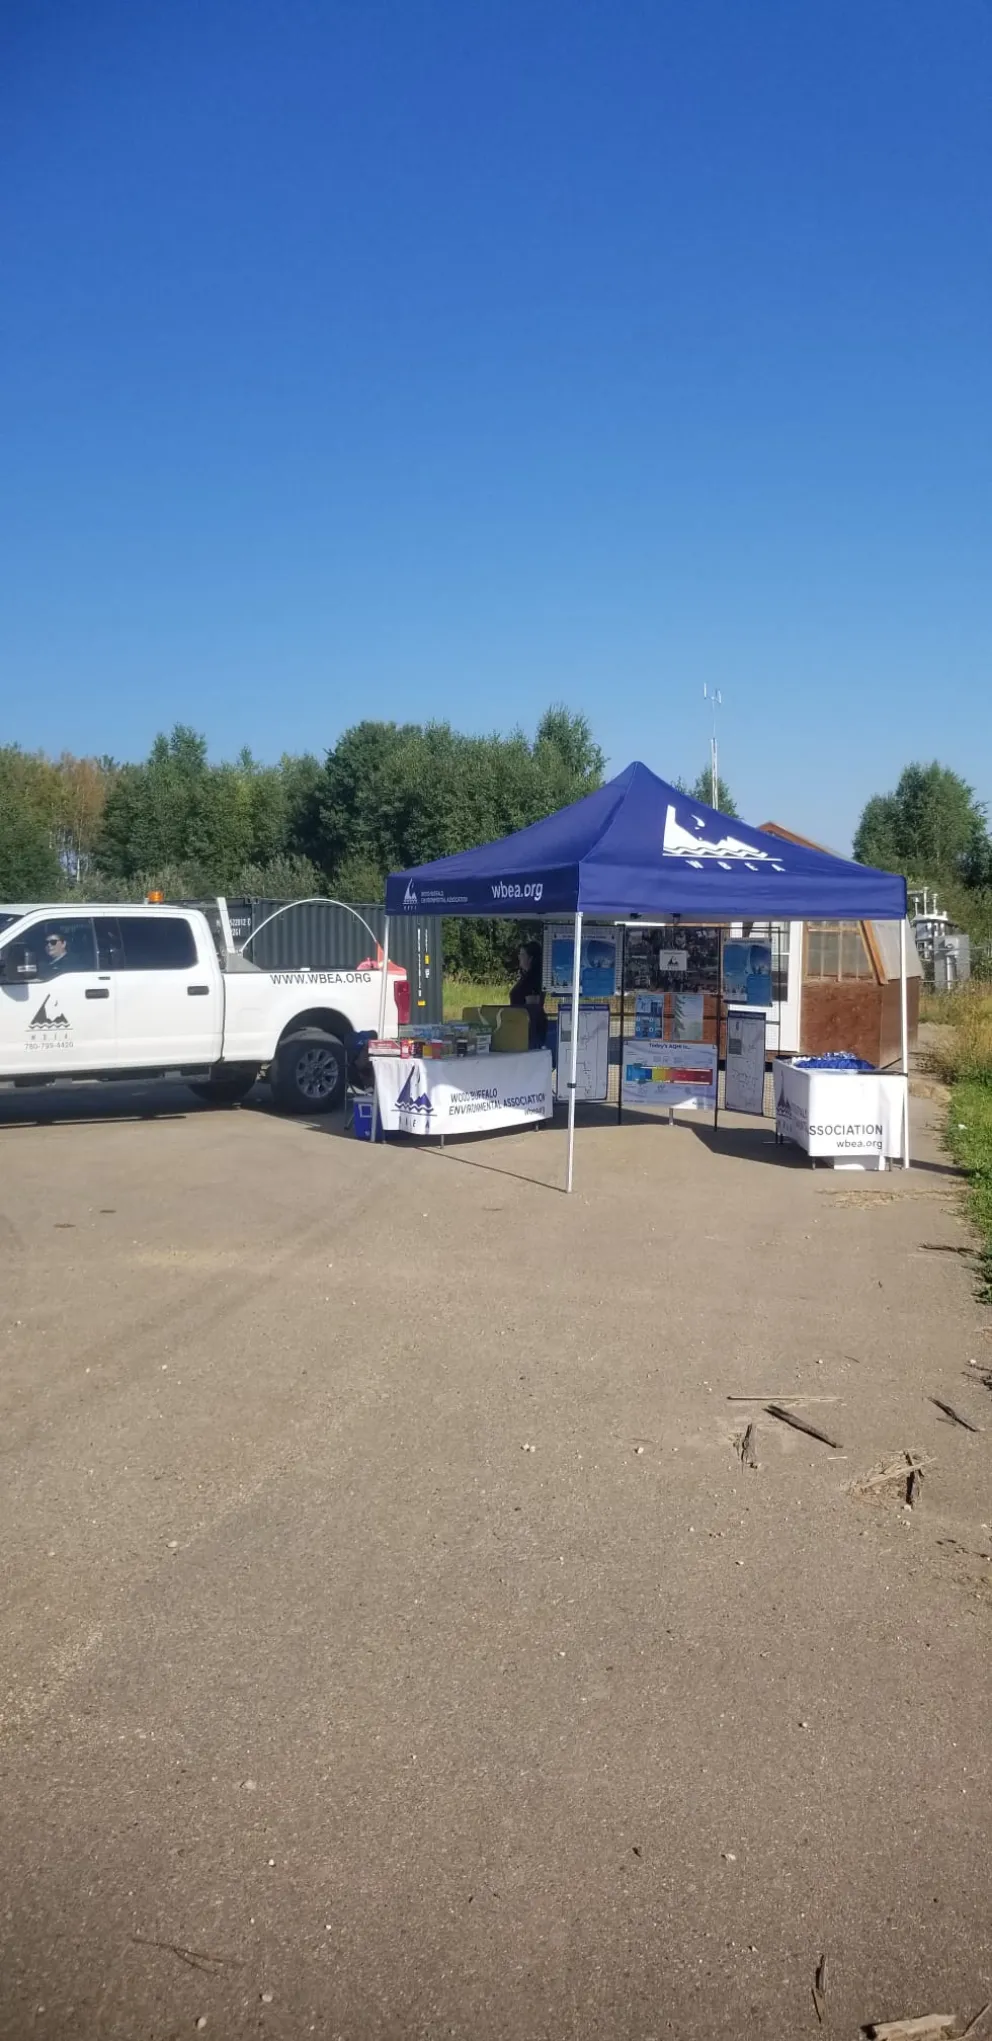
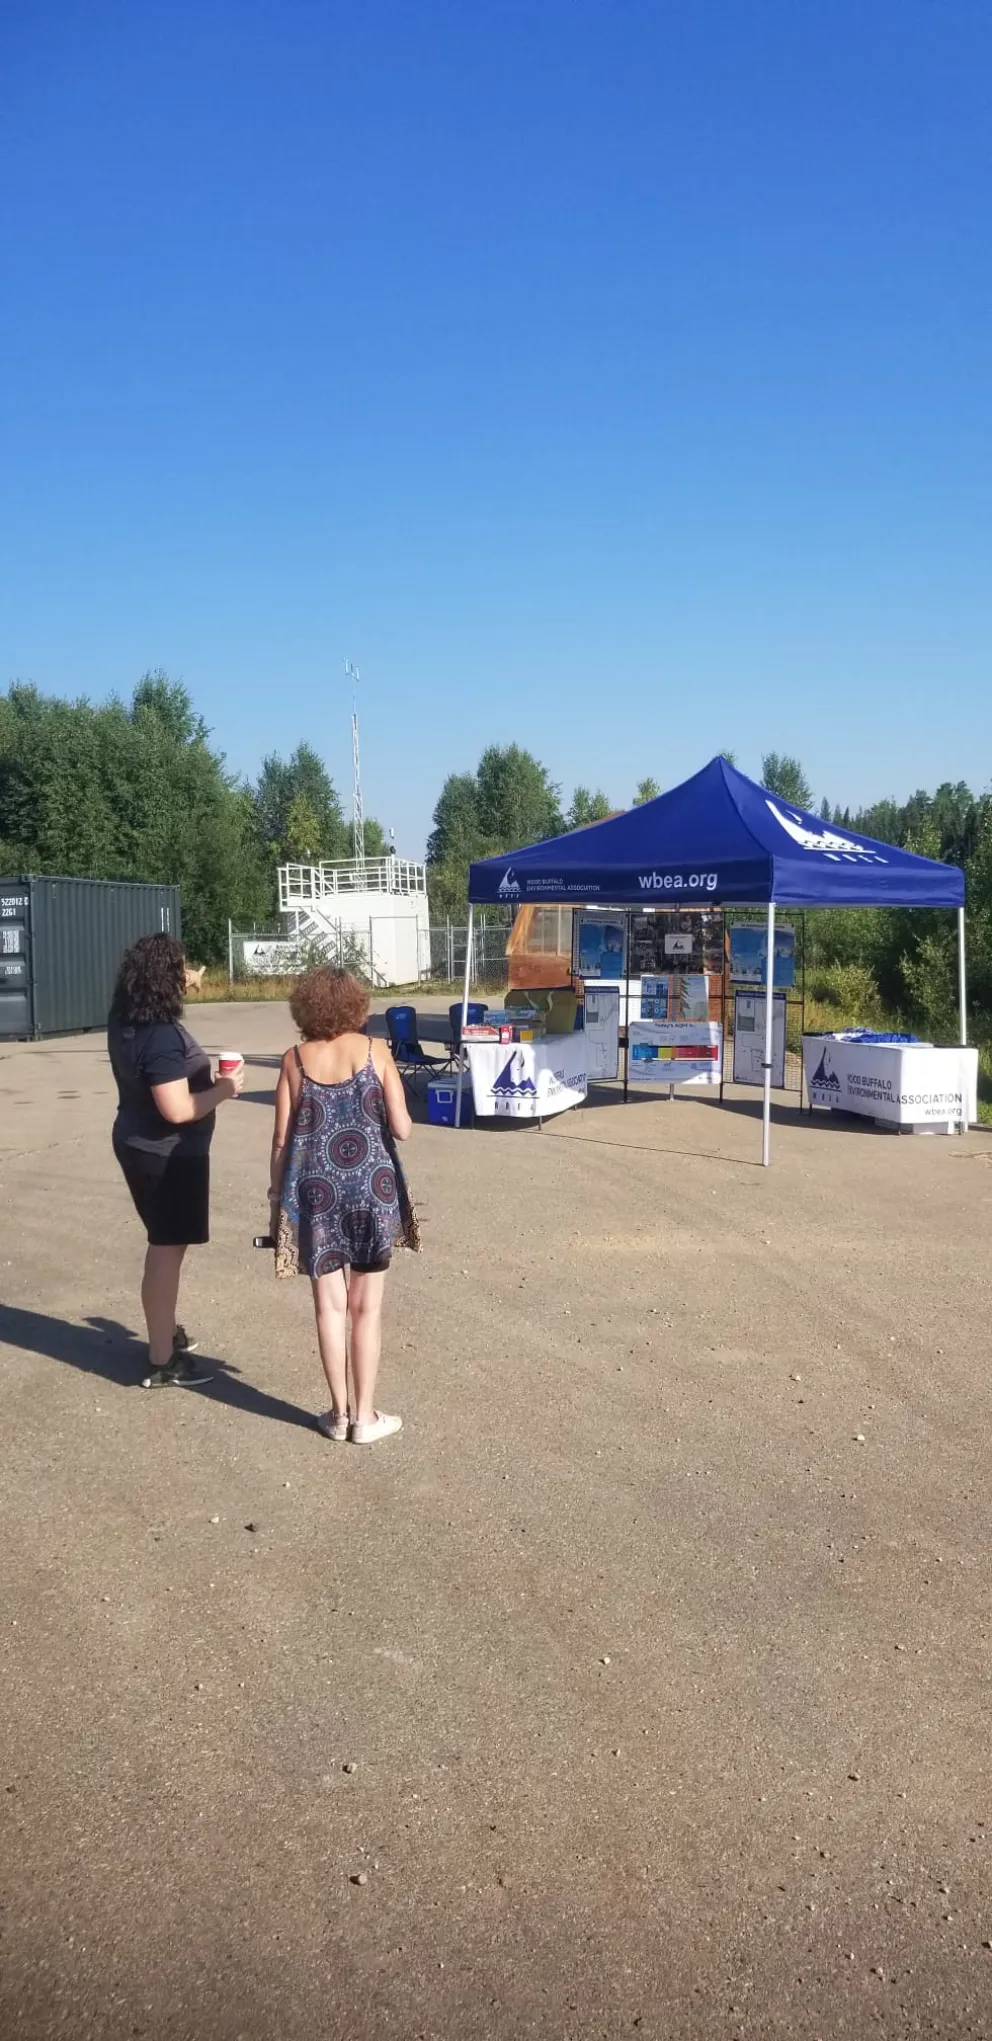
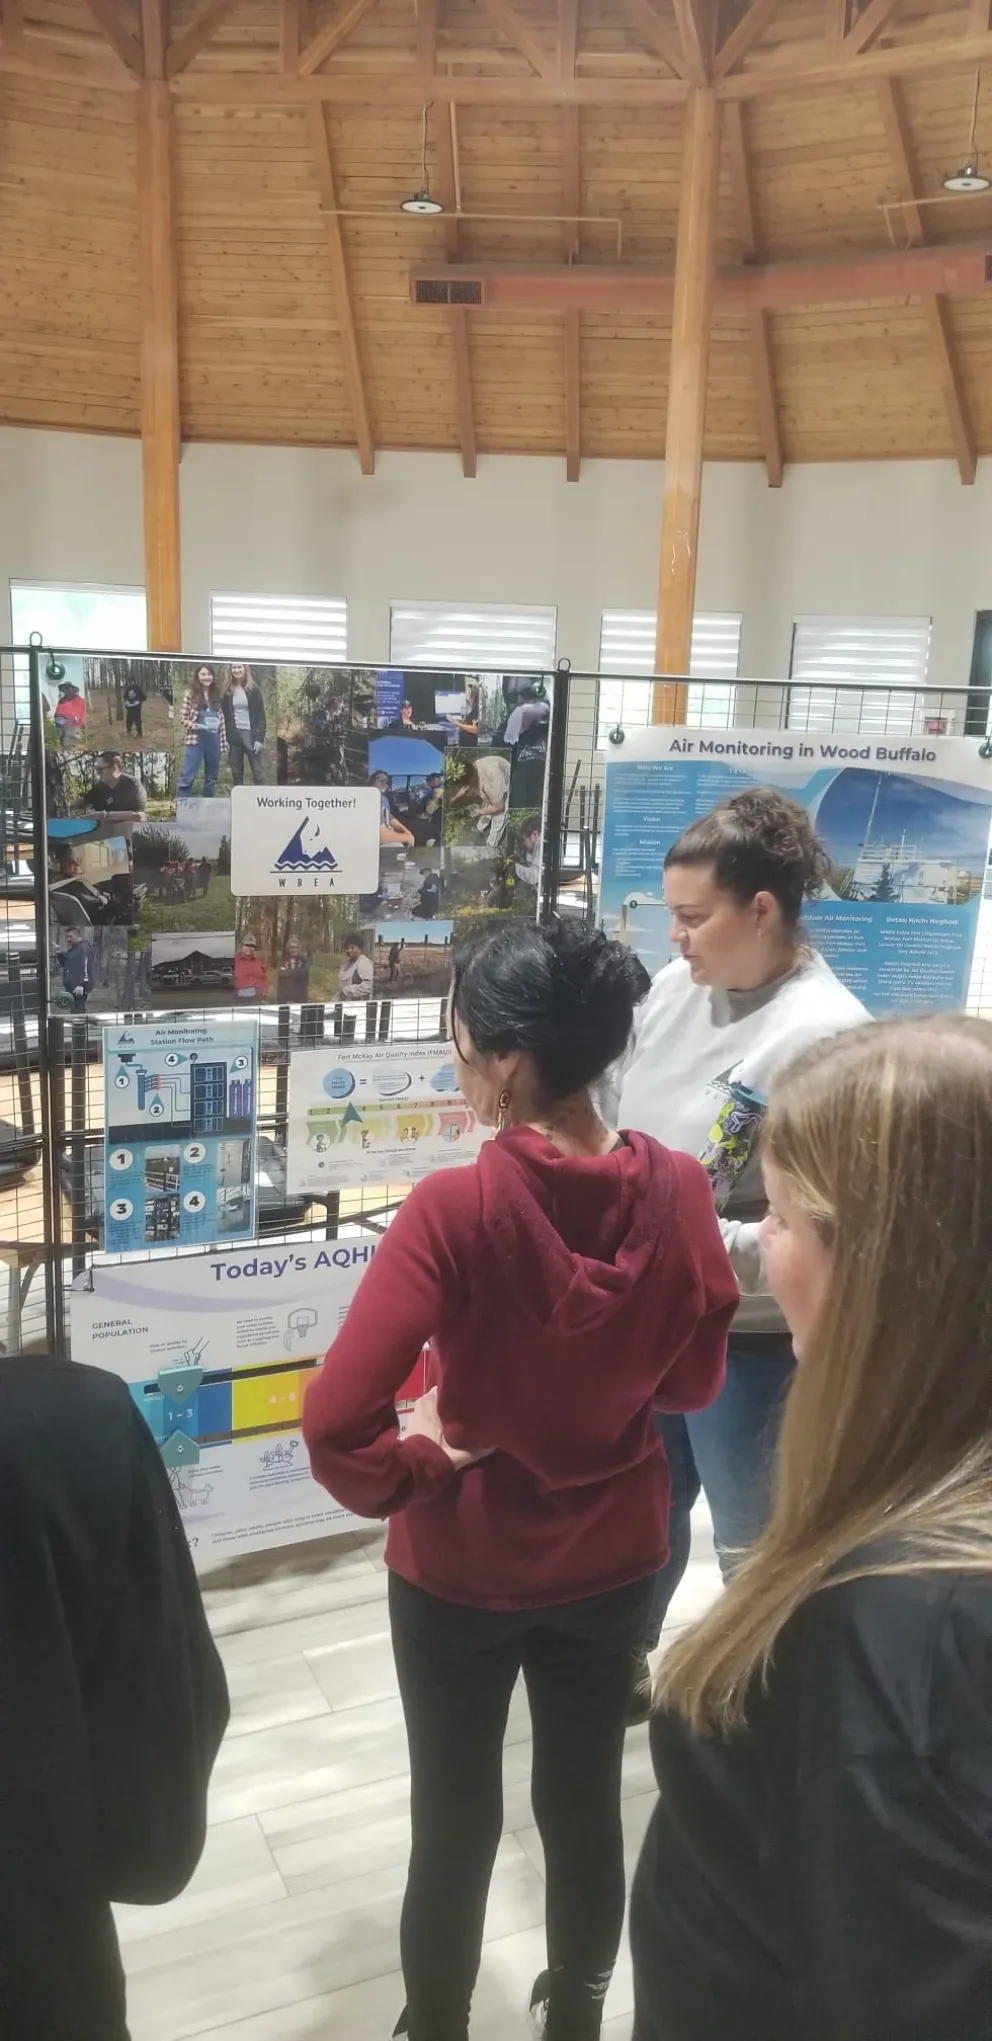
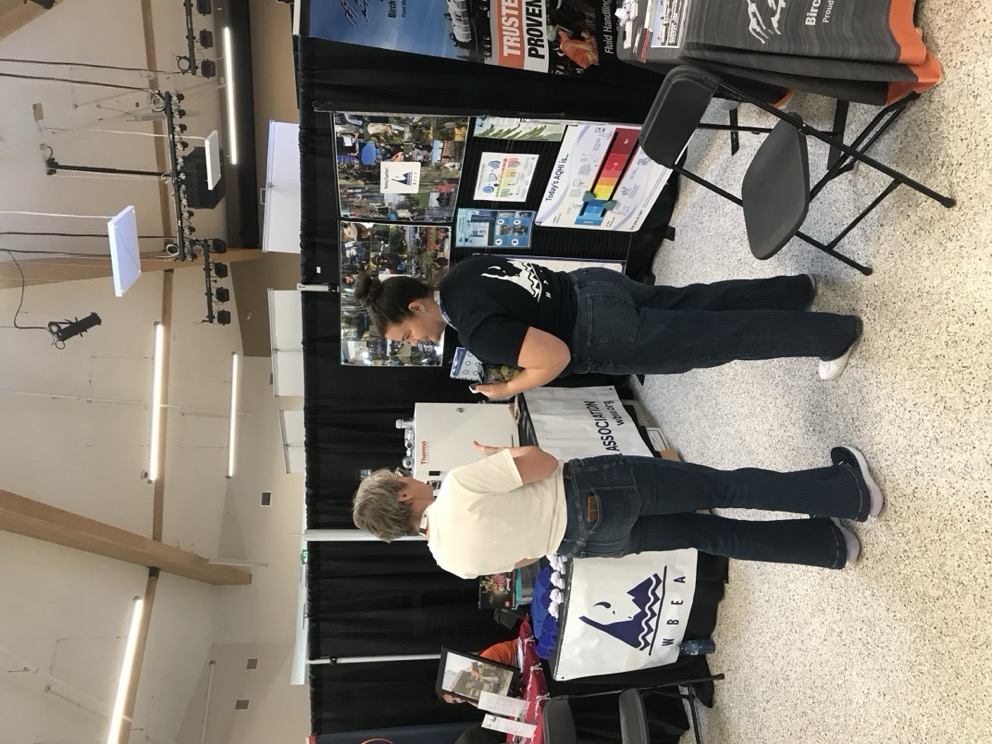
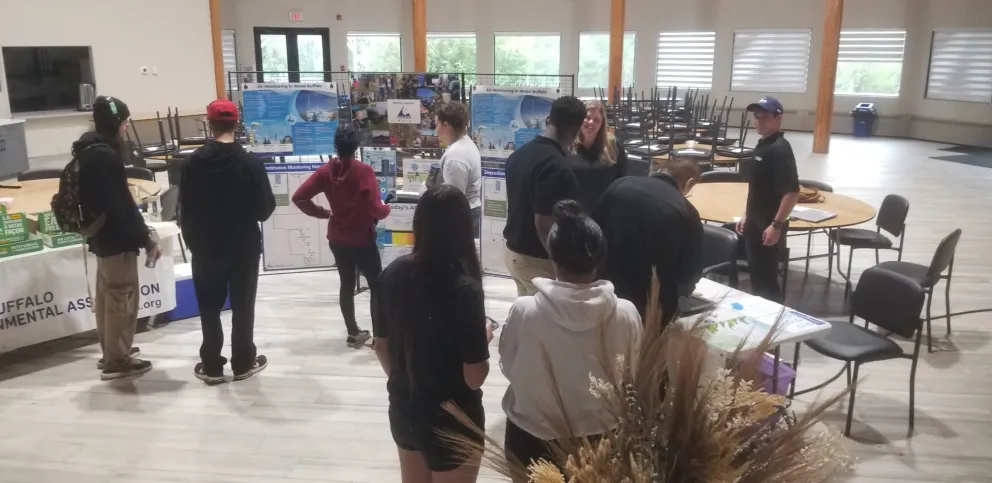
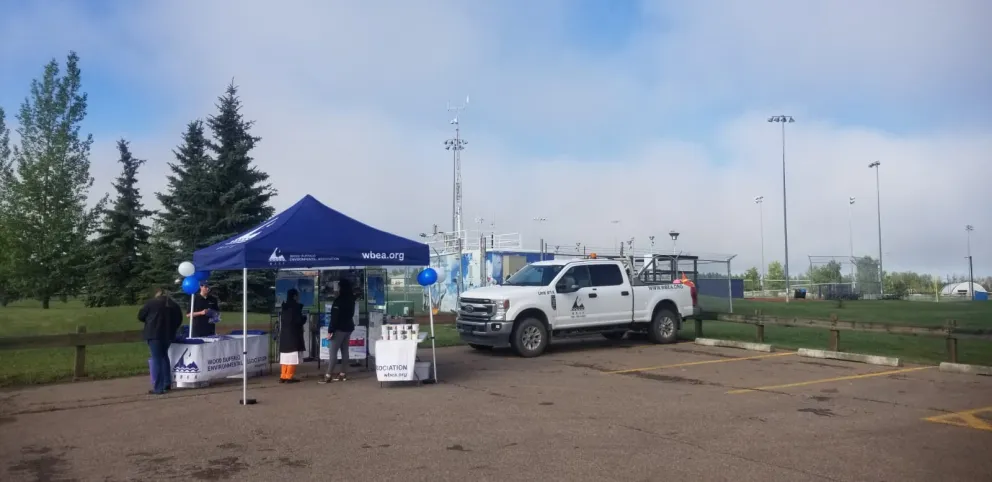
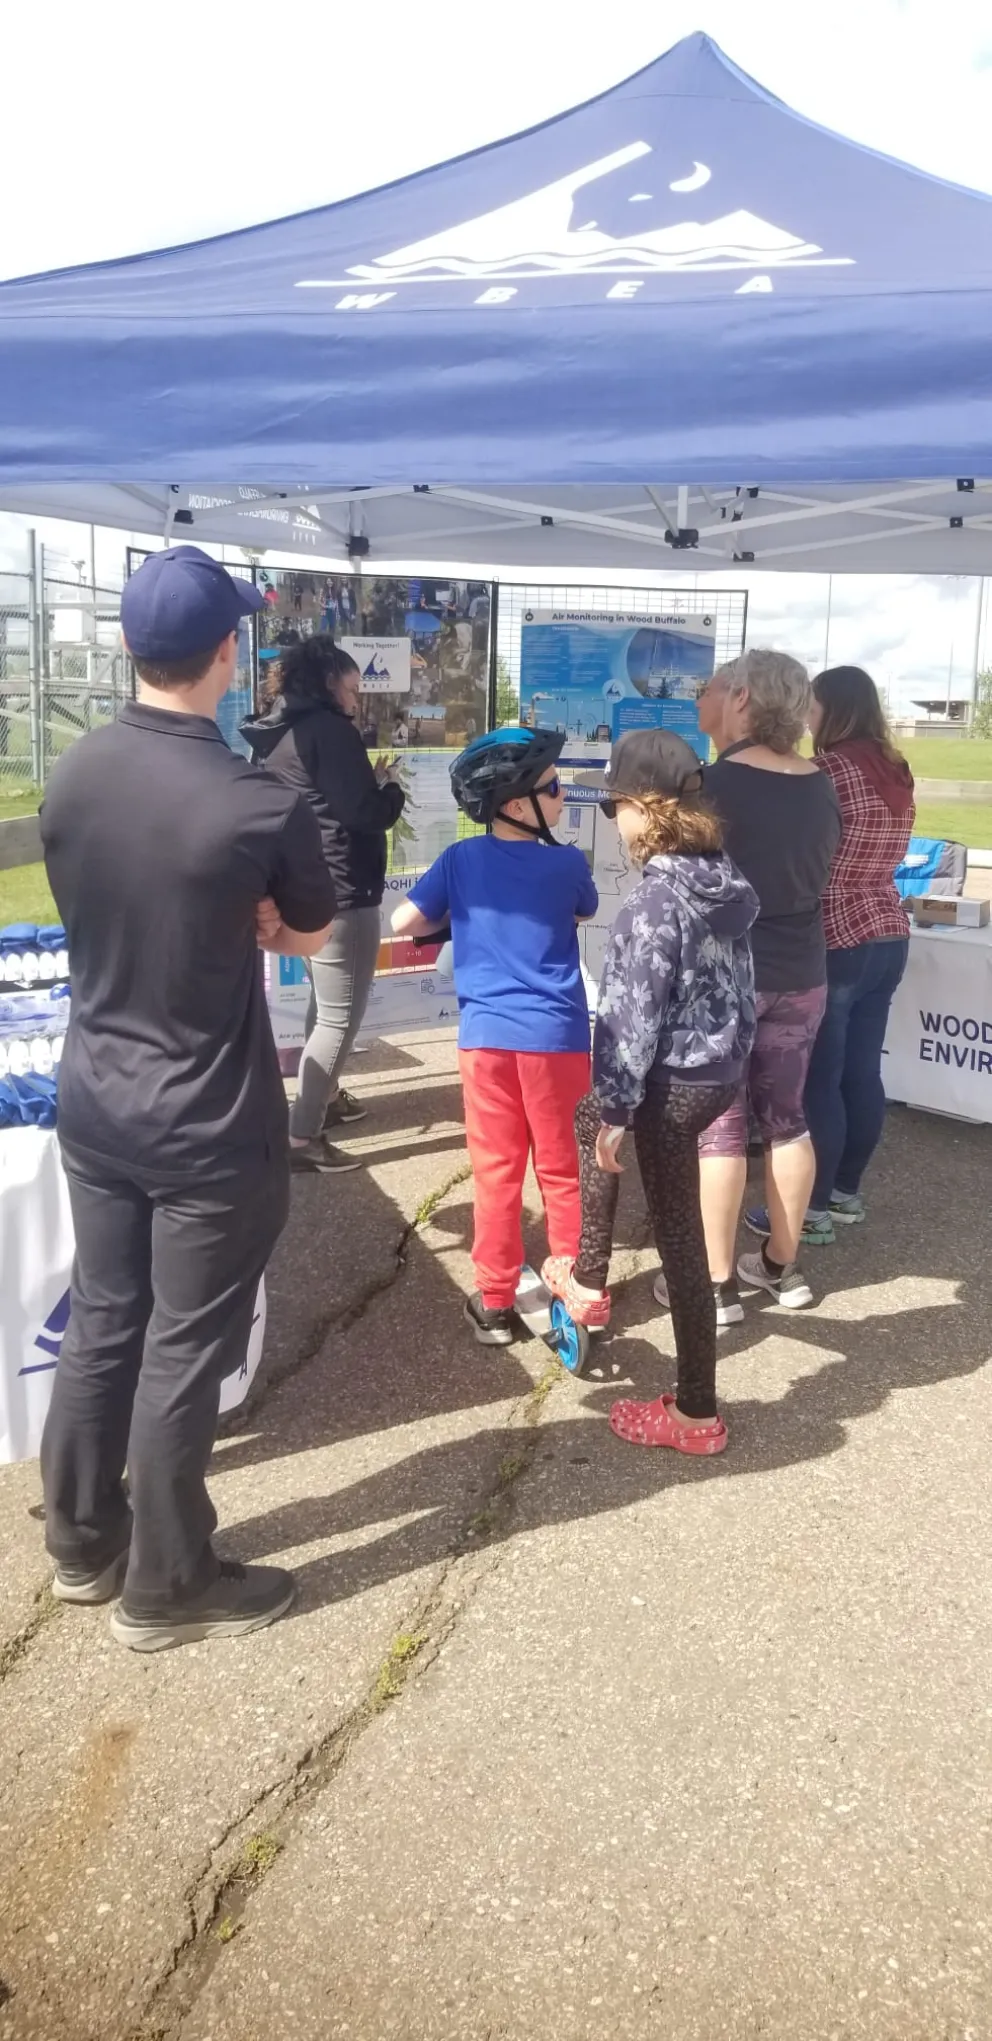
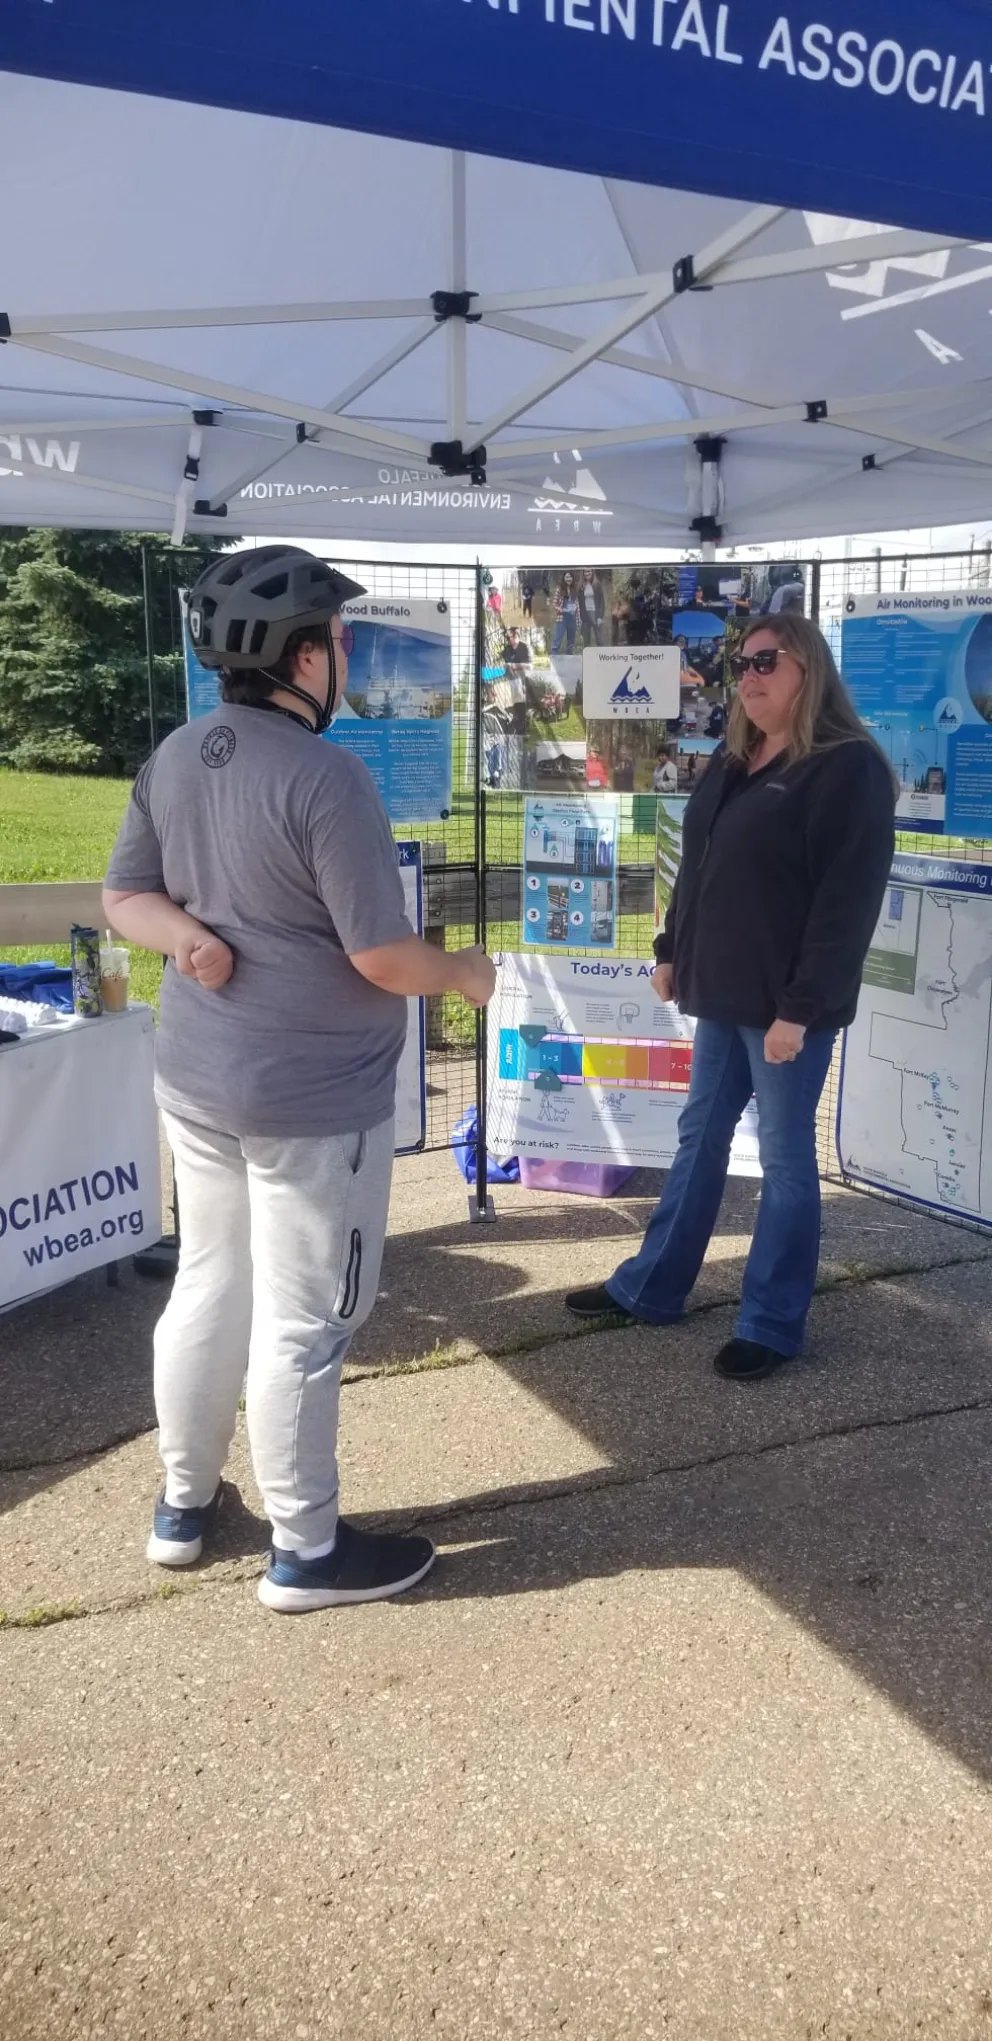
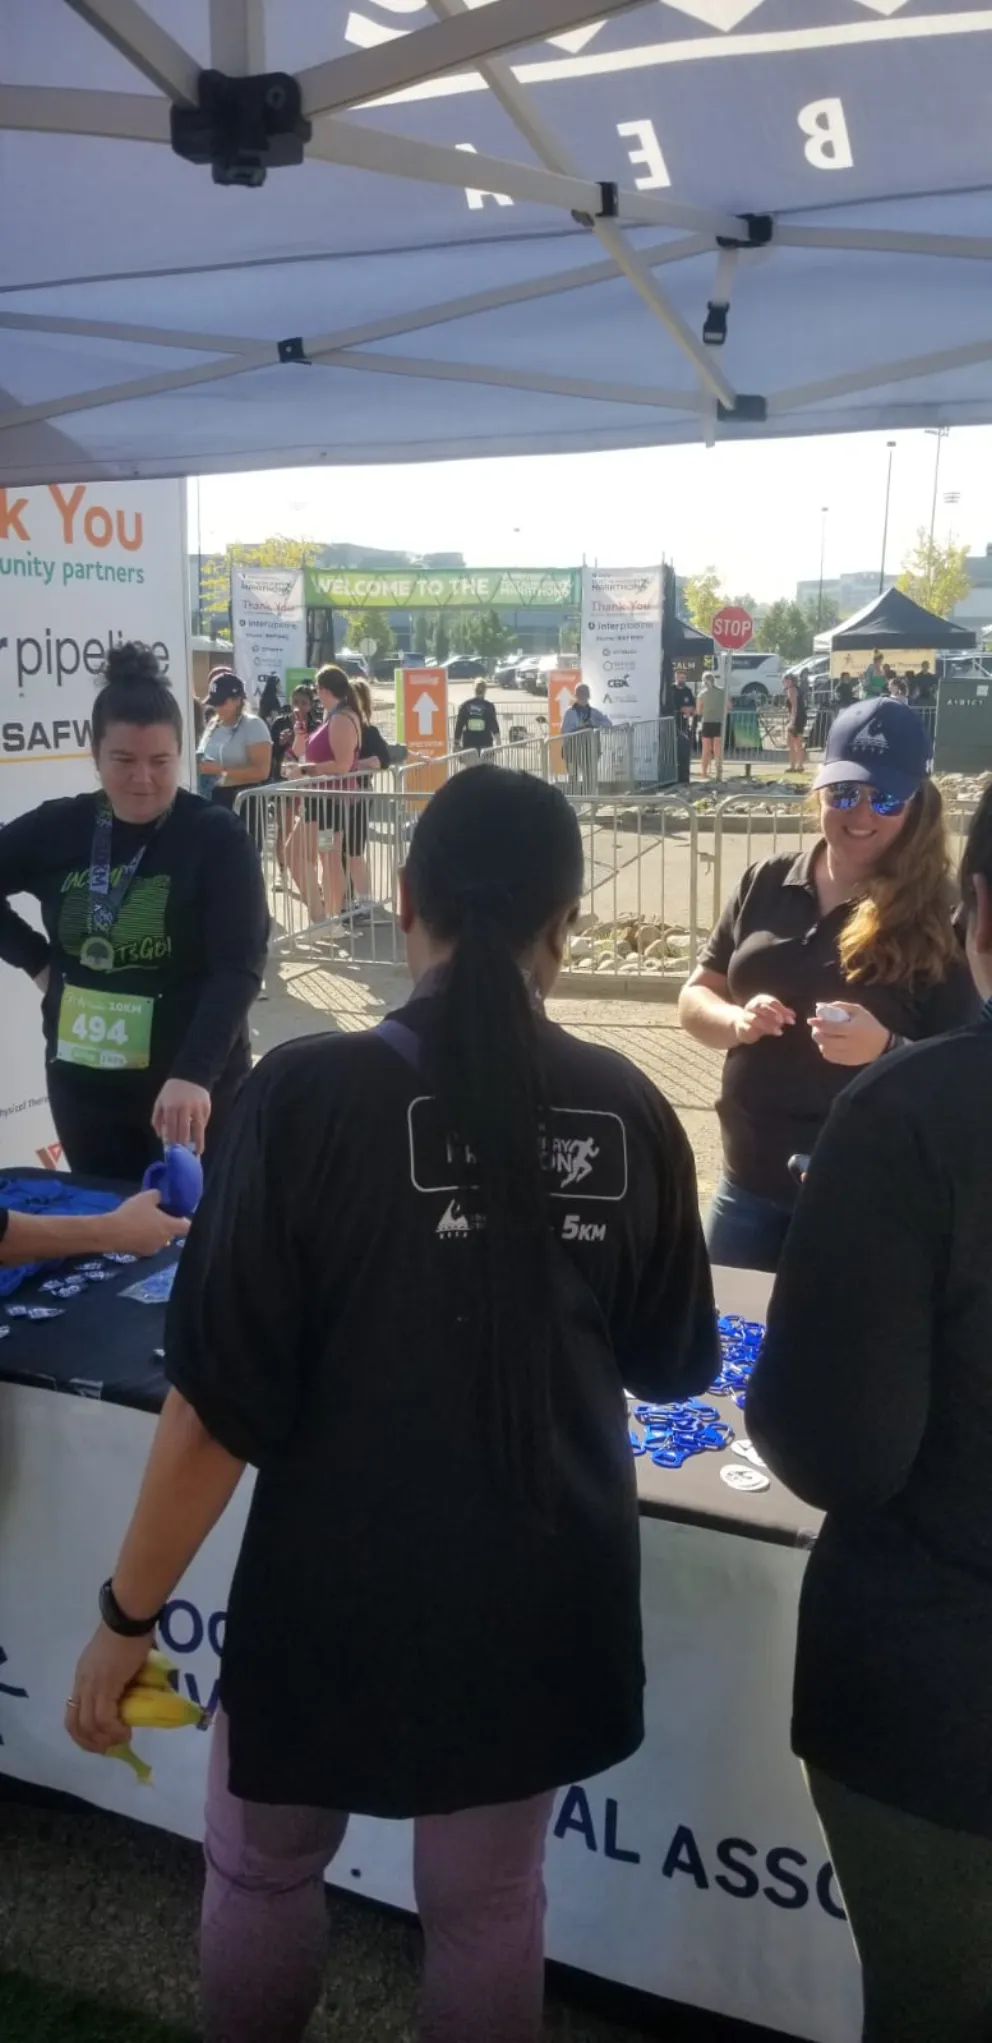
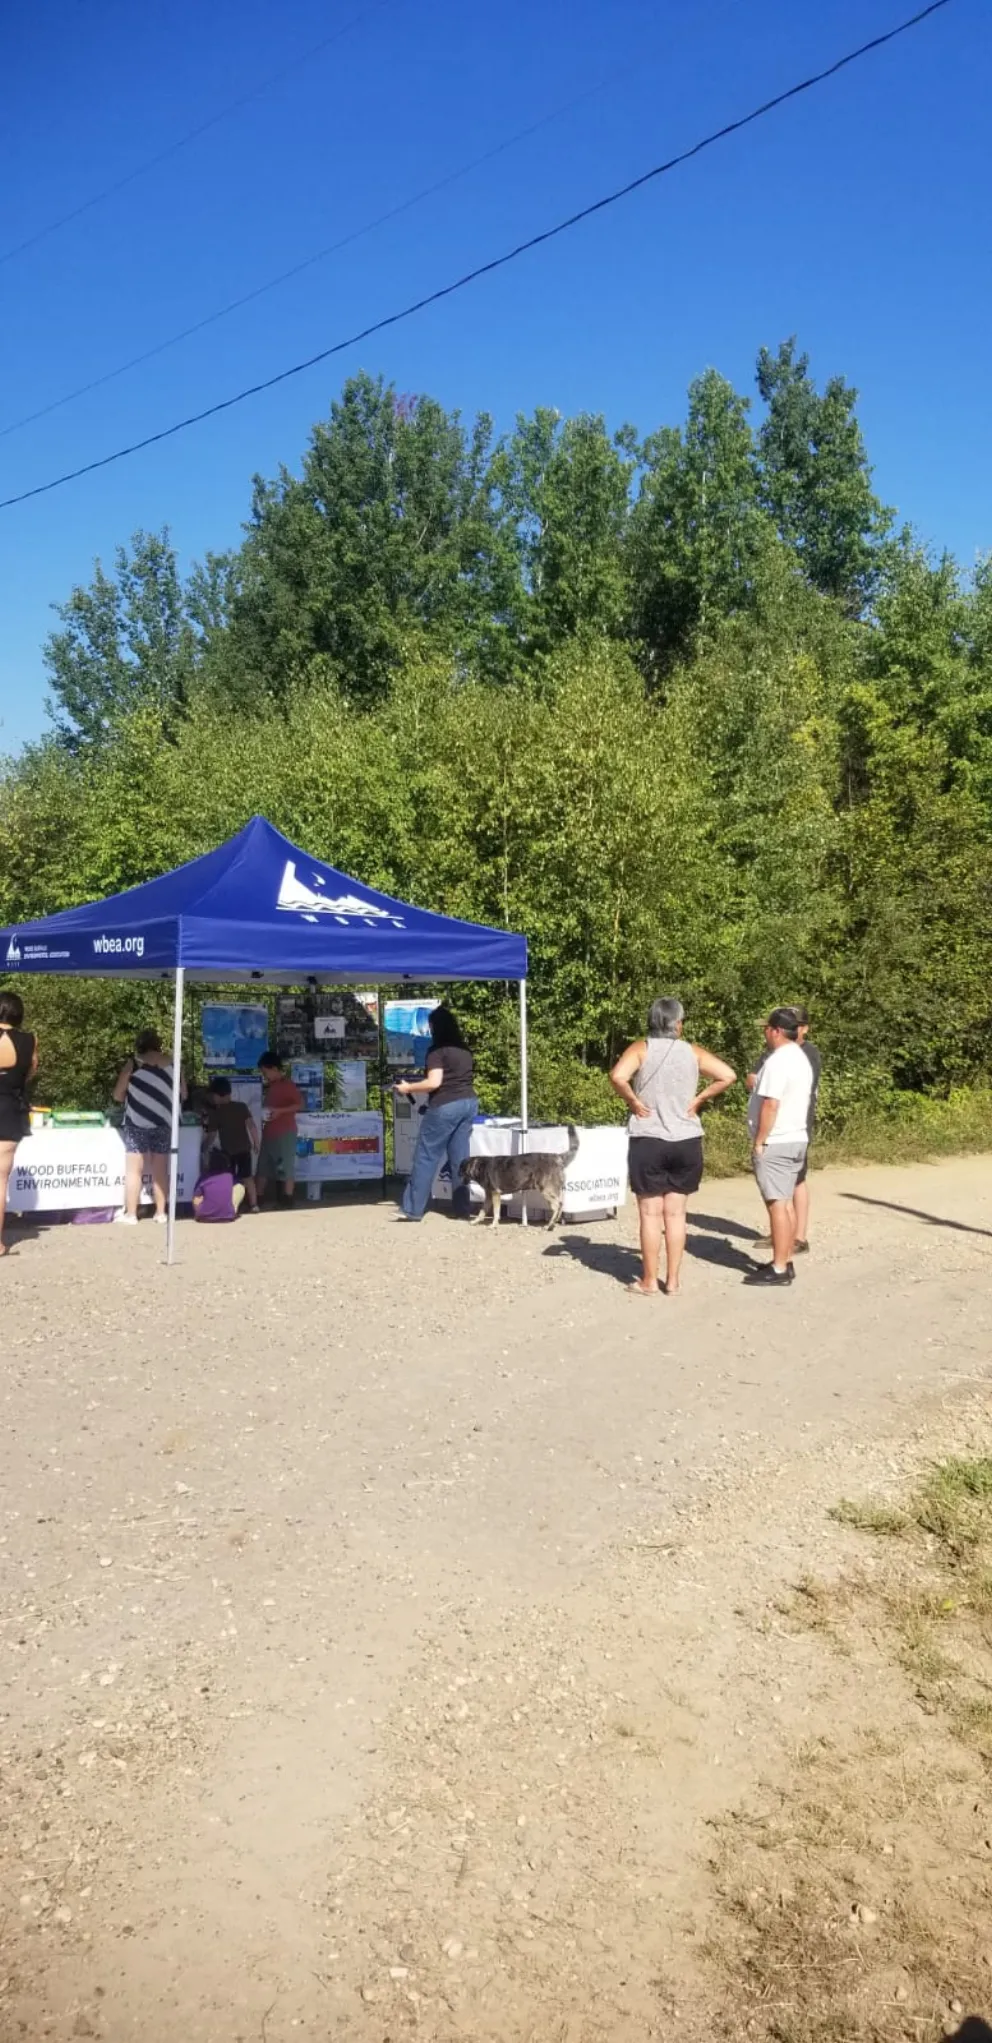
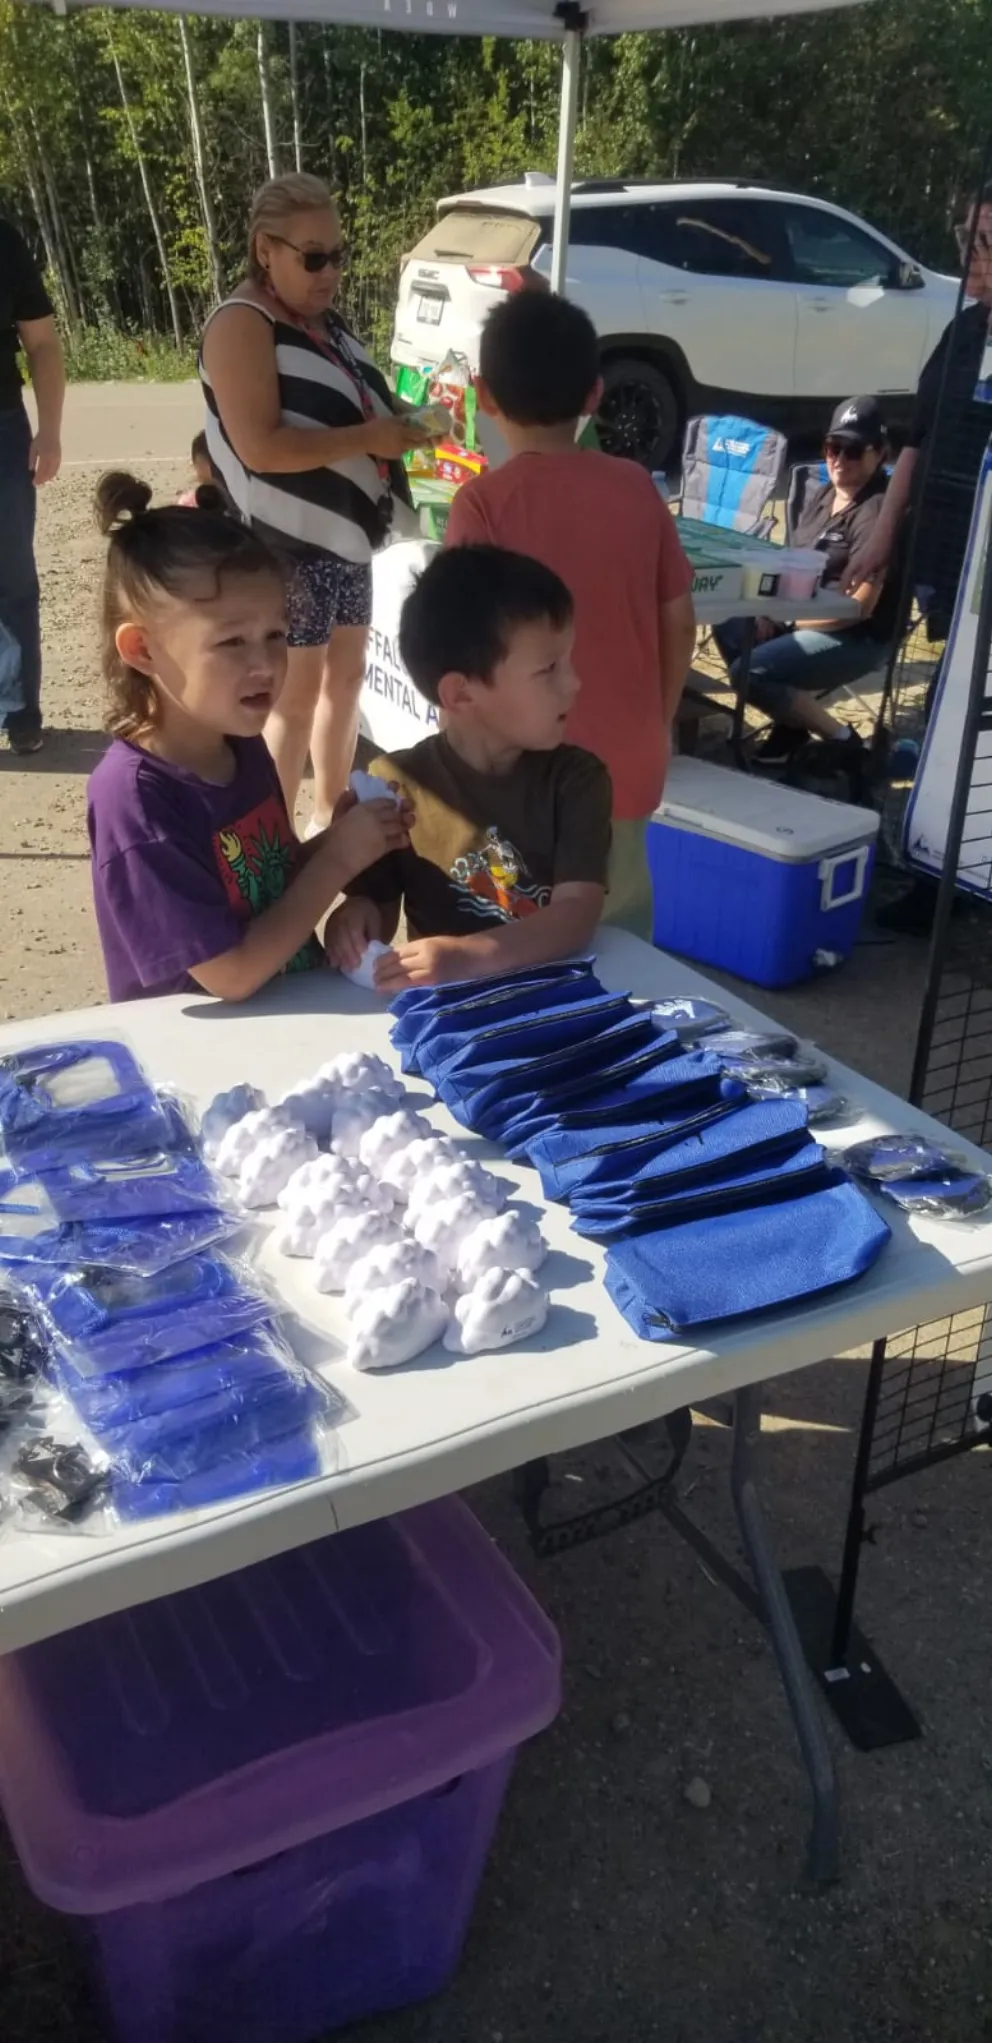
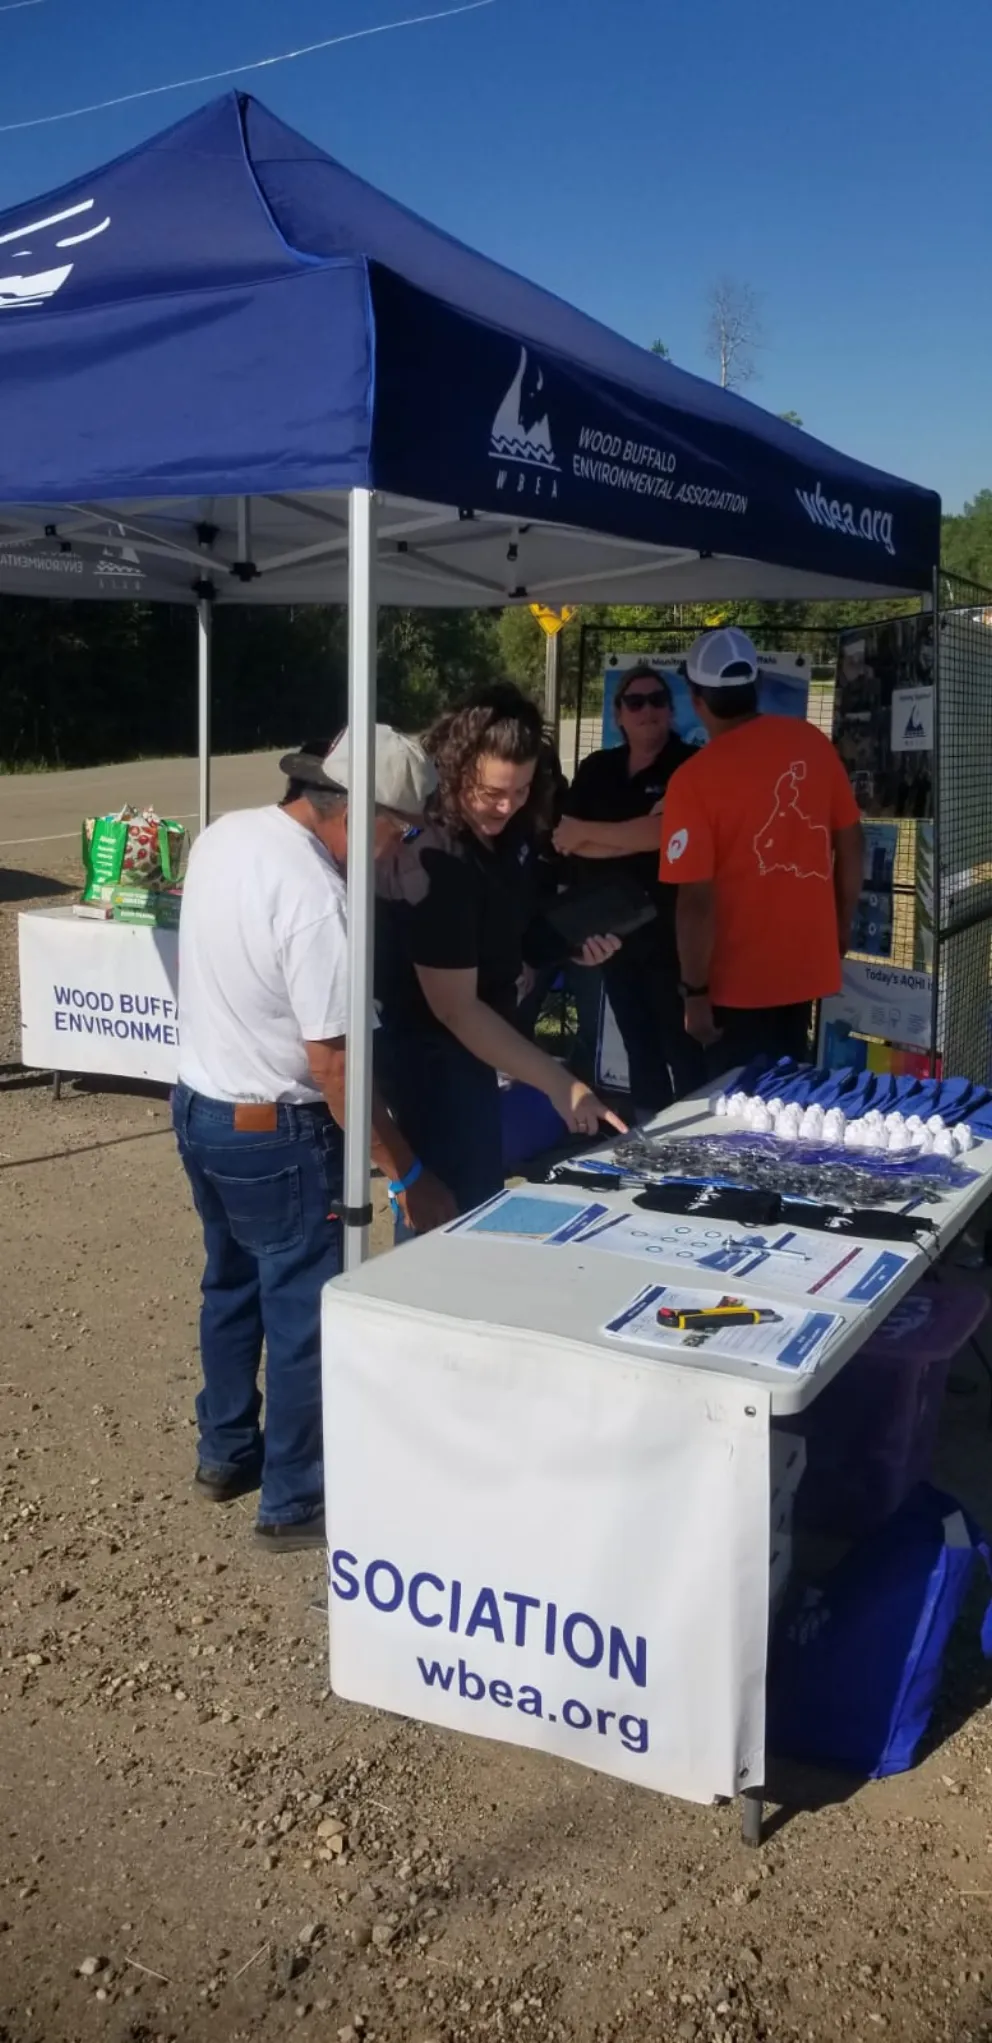
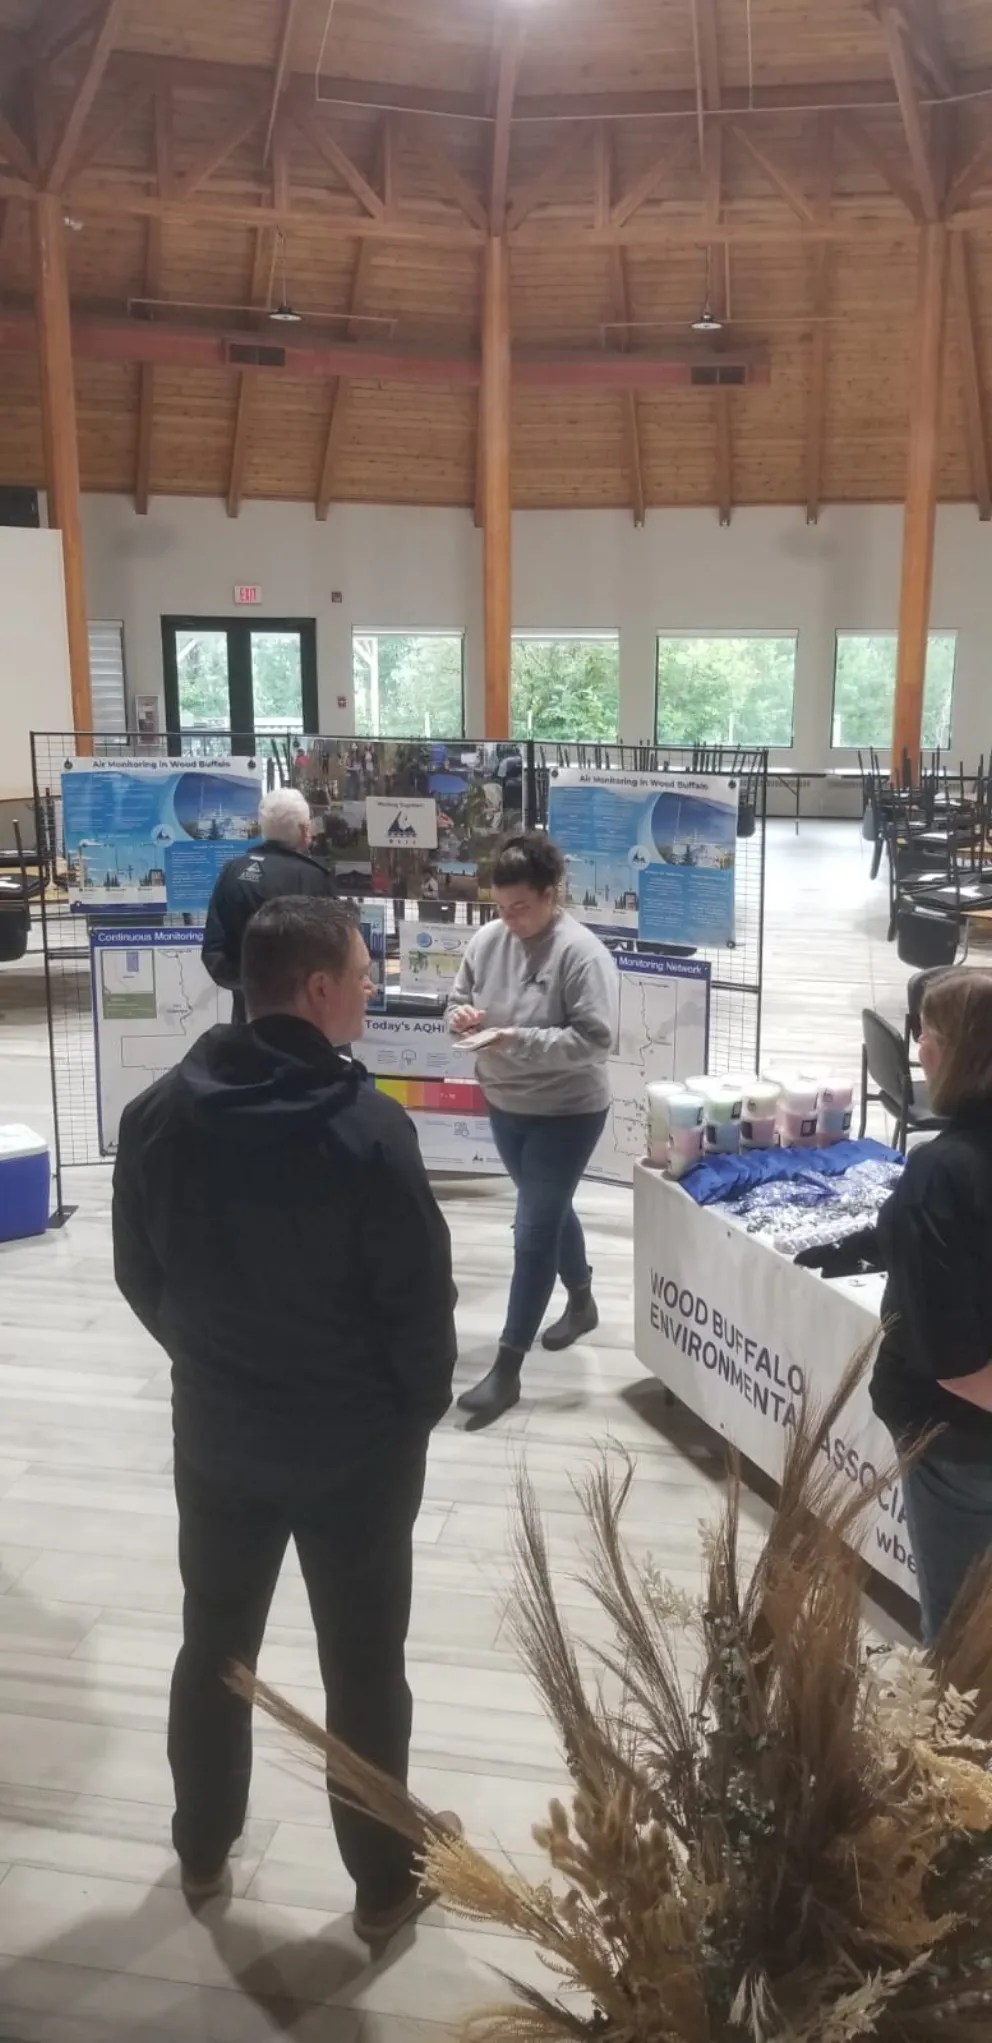
Outreach and engagement remained a priority throughout the year. The WBEA continued to build collaborative partnerships with various non-profits in the region to extend awareness of air quality monitoring and environmental stewardship.
The work highlighted in this report reflects the collective efforts of WBEA staff, members, committees, and partners. Through collaboration, consensus-based decision-making, and meaningful engagement, the WBEA continued to strengthen its role as a trusted source of air quality information in the region. As the organization moves into 2026, these foundations will support continued learning, responsiveness, and shared progress.
We thank you for your continued support of the WBEA and interest in air quality monitoring in the Regional Municipality of Wood Buffalo.

The WBEA’s Ambient Air Monitoring Program collects data 24/7 from monitoring sites south of Conklin to as far north as Fort Chipewyan. Data is compared to government-set standards that define acceptable air quality for environmental and human health. The WBEA's monitoring network is strengthened by the Deposition Monitoring Program, which is collected on a weekly or monthly basis.
Ambient Air Monitoring
The location of the WBEA's continuous and time-integrated monitoring sites including regional meteorological towers.
Deposition Monitoring
Monitoring equipment used to detect impacts of air contaminants on forest health.
Community Air Monitoring Station
These stations are part of the WBEA's Ambient Air Monitoring network.
Click on the purple pins to see the station summaries below.
Alberta’s Air Quality Health Index—AQHI—is a scale designed to provide people with a basic measure of outdoor air quality and the associated level of health risk. Click here to view the complete 2025 AQHI summary.
Learn More About AQHIThe WBEA was fortunate to work with many organizations in 2025. Each partner organization is key in supporting the WBEA’s vision, mission, and values. The tabs below expand to highlight ongoing WBEA partnerships.
Athabasca Chipewyan First Nation
Chipewyan Prairie First Nation
Christina River Dene Nation Council
Fort McMurray 468 First Nation
Alberta Environment and Protected Areas
Alberta Primary and Preventative Health Services

2025 Hourly Annual Average
Low Risk 94%
Moderate Risk 4%
High Risk 2%
Very High Risk 0%
* AQHI summaries are based on raw data and may require minor corrections after final review in May 2026.
9
Air Pollutants
Monitored
99.2%
Air Monitoring
Network Uptime
South Southeast
Most Common Wind Direction
360
Sample Change-
Outs
65
Community
Members Engaged
(approximate)
32.6°C (August)
Highest Ambient
Temperature
445 Hours
WBEA Tech
Station Visits
-37.6°C (February)
Lowest Ambient
Temperature
2025 Hourly Annual Average
Low Risk 94%
Moderate Risk 4%
High Risk 2%
Very High Risk 0%
* AQHI summaries are based on raw data and may require minor corrections after final review in May 2026.
10
Air Pollutants
Monitored
98.8%
Air Monitoring
Network Uptime
South
Most Common Wind Direction
360
Sample Change-
Outs
37
Community
Members Engaged
(approximate)
32.4°C (August)
Highest Ambient
Temperature
415 Hours
WBEA Tech
Station Visits
-40°C (February)
Lowest Ambient
Temperature

2025 Hourly Annual Average
Low Risk 95%
Moderate Risk 4%
High Risk 1%
Very High Risk 0%
* AQHI summaries are based on raw data and may require minor corrections after final review in May 2026.
9
Air Pollutants
Monitored
87.9%
Air Monitoring
Network Uptime
East
Most Common Wind Direction
385
Sample Change-
Outs
93
Community
Members Engaged
(approximate)
33.3°C (August)
Highest Ambient
Temperature
338 Hours
WBEA Tech
Station Visits
-38.5°C (February)
Lowest Ambient
Temperature
15.3 mm
Precipitation

2025 Hourly Annual Average
Low Risk 90%
Moderate Risk 8%
High Risk 2%
Very High Risk 0%
* AQHI summaries are based on raw data and may require minor corrections after final review in May 2026.
14
Air Pollutants
Monitored
92.5%
Air Monitoring
Network Uptime
South
Most Common Wind Direction
543
Sample Change-
Outs
125
Community
Members Engaged
(approximate)
33.3°C (August)
Highest Ambient
Temperature
730 Hours
WBEA Tech
Station Visits
-38.2°C (January)
Lowest Ambient
Temperature
25.2 mm
Precipitation


2025 Hourly Annual Average
Low Risk 92%
Moderate Risk 5%
High Risk 2%
Very High Risk 0%
* AQHI summaries are based on raw data and may require minor corrections after final review in May 2026.
*Two-Station Summary
11
Air Pollutants
Monitored
98.45%
Air Monitoring
Network Uptime
Southeast
Most Common Wind Direction
720
Sample Change-
Outs
307
Community
Members Engaged
(approximate)
34.5°C (July)
Highest Ambient
Temperature
813 Hours
WBEA Tech
Station Visits
-37.8°C (February)
Lowest Ambient
Temperature
2025 Hourly Annual Average
Low Risk 94%
Moderate Risk 4%
High Risk 2%
Very High Risk 0%
* AQHI summaries are based on raw data and may require minor corrections after final review in May 2026.
10
Air Pollutants
Monitored
95.4%
Air Monitoring
Network Uptime
South Southwest
Most Common Wind Direction
360
Sample Change-
Outs
37
Community
Members Engaged
(approximate)
32.7°C (August)
Highest Ambient
Temperature
355 Hours
WBEA Tech
Station Visits
-36.3°C (February)
Lowest Ambient
Temperature
Note: The facts below are a combined summary.
Up to 12
Air Pollutants
Monitored
98.47%
Air Monitoring
Network Uptime
814
Sample Change-
Outs
6884 Hours
WBEA Tech
Station Visits
34.8°C
(July @ Lower Camp AMS)
Highest Ambient
Temperature
25
Total Industry Stations
-40.4°C
(January @ Ells River AMS)
Lowest Ambient
Temperature
The WBEA is a member of the Alberta Airsheds Council (AAC), which is a partnership of Alberta’s Airsheds and provides leadership in support of healthy air quality for Albertans and the environment.
The AAC provides a forum for Airsheds to work and learn together, to continue to advance effective and efficient air monitoring, reporting and outreach, and to address regional matters. Click the link below to visit the AAC website.
Learn More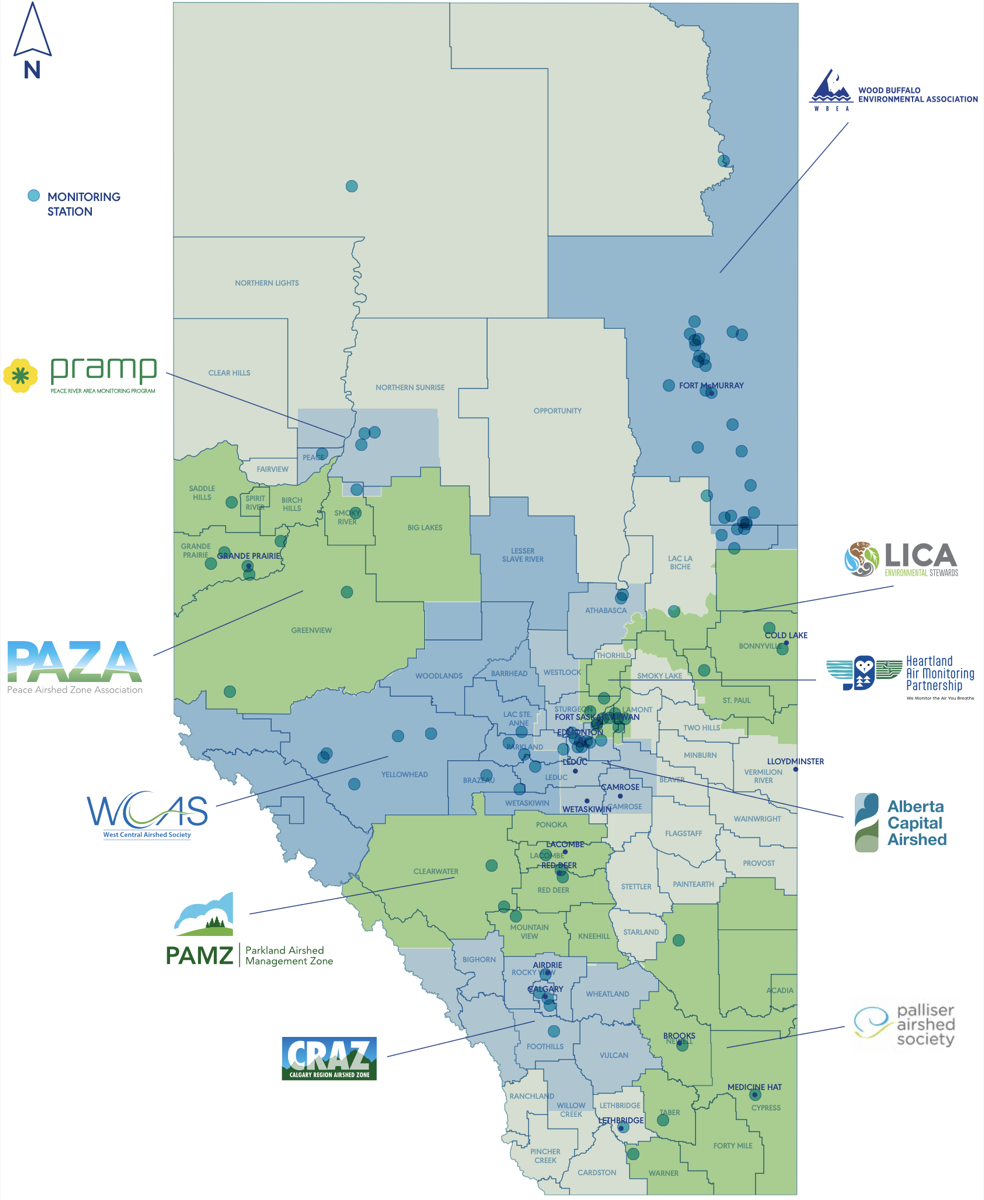
The WBEA is fortunate to work with partners across the province, including Alberta Environment and Protected Areas (AEPA) and the Oil Sands Monitoring (OSM) Program. The WBEA acknowledges the financial support of the AEPA and the OSM Program. The work included in this report was partially funded under the OSM Program and is independent of any position of the OSM Program. To learn more about the WBEA's involvement with these partnerships, visit:
Alberta Environments and Protected AreasClick onHover over the titles along the top of the table to see a description of each metric.
| Air pollutants Monitored | Air Monitoring Network Uptime | Highest Temperature | Lowest Temperature | Community Members Engaged (approximate) |
Most Common Wind Direction | Sample Change-Outs | WBEA Tech Station Visits (hours) |
|
|---|---|---|---|---|---|---|---|---|
| Anzac | 9 | 99.2% | 32.6°C | -37.6°C | 65 | South Southeast | 360 | 445 |
| Conklin | 10 | 98.8% | 32.4°C | -40°C | 37 | South | 360 | 415 |
| Fort Chipewyan | 9 | 87.9% | 33.3°C | -38.5°C | 93 | East | 385 | 338 |
| Fort McKay - Bertha Ganter | 14 | 92.5% | 33.3°C | -38.2°C | 125 | South | 543 | 730 |
| Fort McMurray *Two-Station Summary |
11 | 98.45% | 34.5°C | -37.8°C | 307 | Southeast | 720 | 813 |
| Janvier | 10 | 95.4% | 32.7°C | -36.3°C | 37 | South Southwest | 360 | 355 |
Anzac
Low Risk 94%
Moderate Risk 4%
High Risk 2%
Very High Risk 0%
Conklin
Low Risk 94%
Moderate Risk 4%
High Risk 2%
Very High Risk 0%
Fort Chipewyan
Low Risk 95%
Moderate Risk 4%
High Risk 1%
Very High Risk 0%
Fort McKay - Bertha Ganter
Low Risk 90%
Moderate Risk 8%
High Risk 2%
Very High Risk 0%
Fort McMurray
Low Risk 92%
Moderate Risk 5%
High Risk 2%
Very High Risk 0%
Janvier
Low Risk 94%
Moderate Risk 4%
High Risk 2%
Very High Risk 0%
* AQHI summaries are based on raw data and may require minor corrections after final review in May 2026.
Collaboration with Indigenous communities in the Wood Buffalo region is a core focus of the WBEA. Indigenous communities participate as partners in project planning, decision-making, and the execution of WBEA monitoring initiatives.
Fort Chipewyan Métis Nation and Willow Lake Métis Nation joined the WBEA as Members in 2025. With their addition, all Indigenous communities in the region are now formally represented within the WBEA’s membership, bringing unique perspectives and representation for each community.
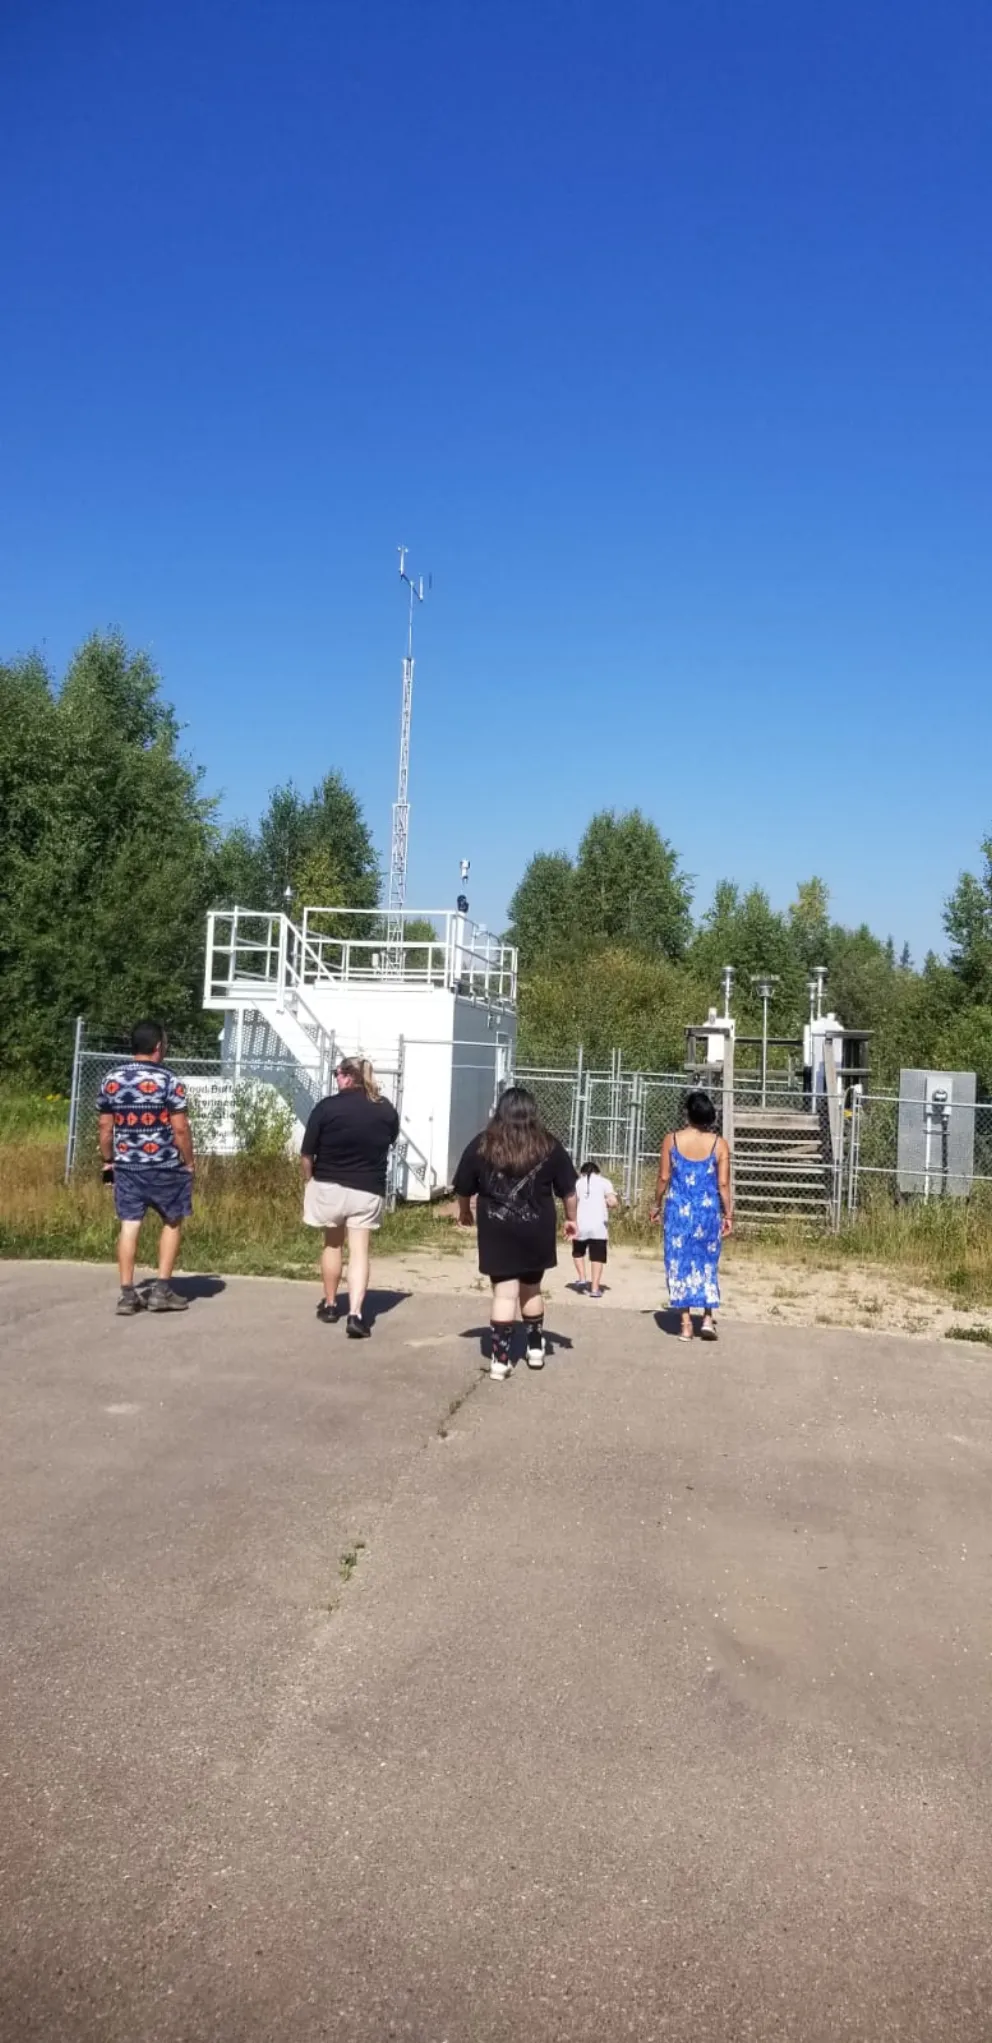
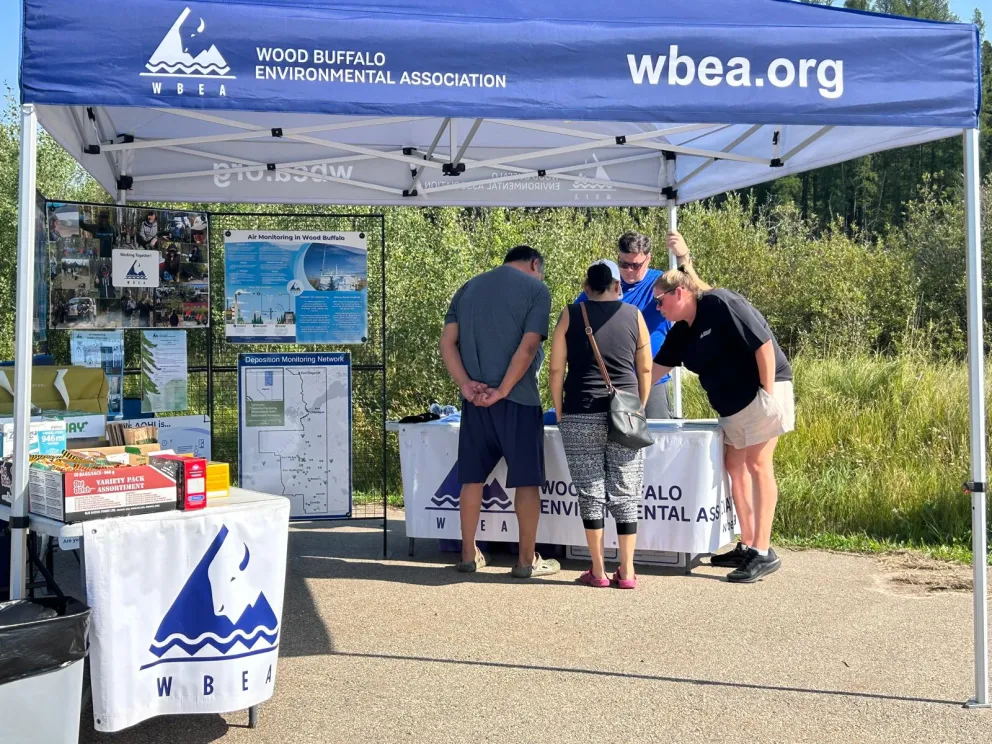
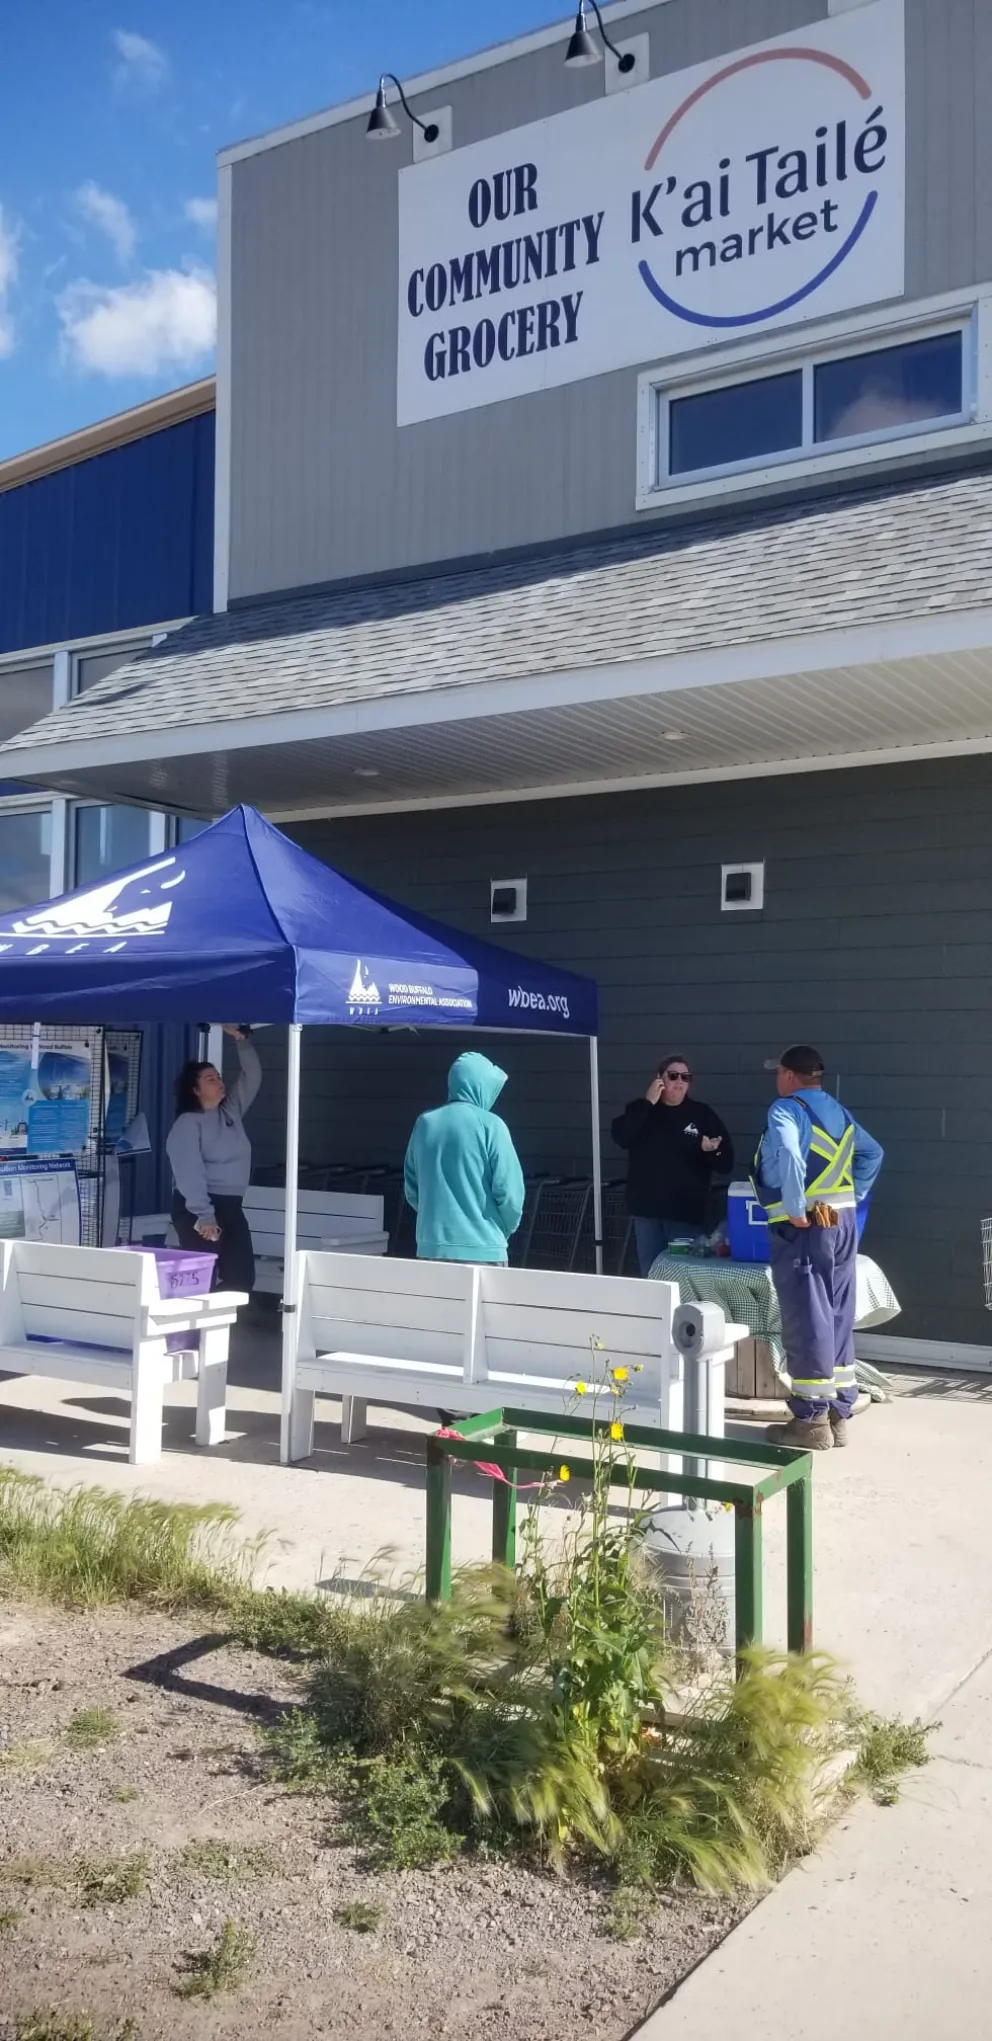
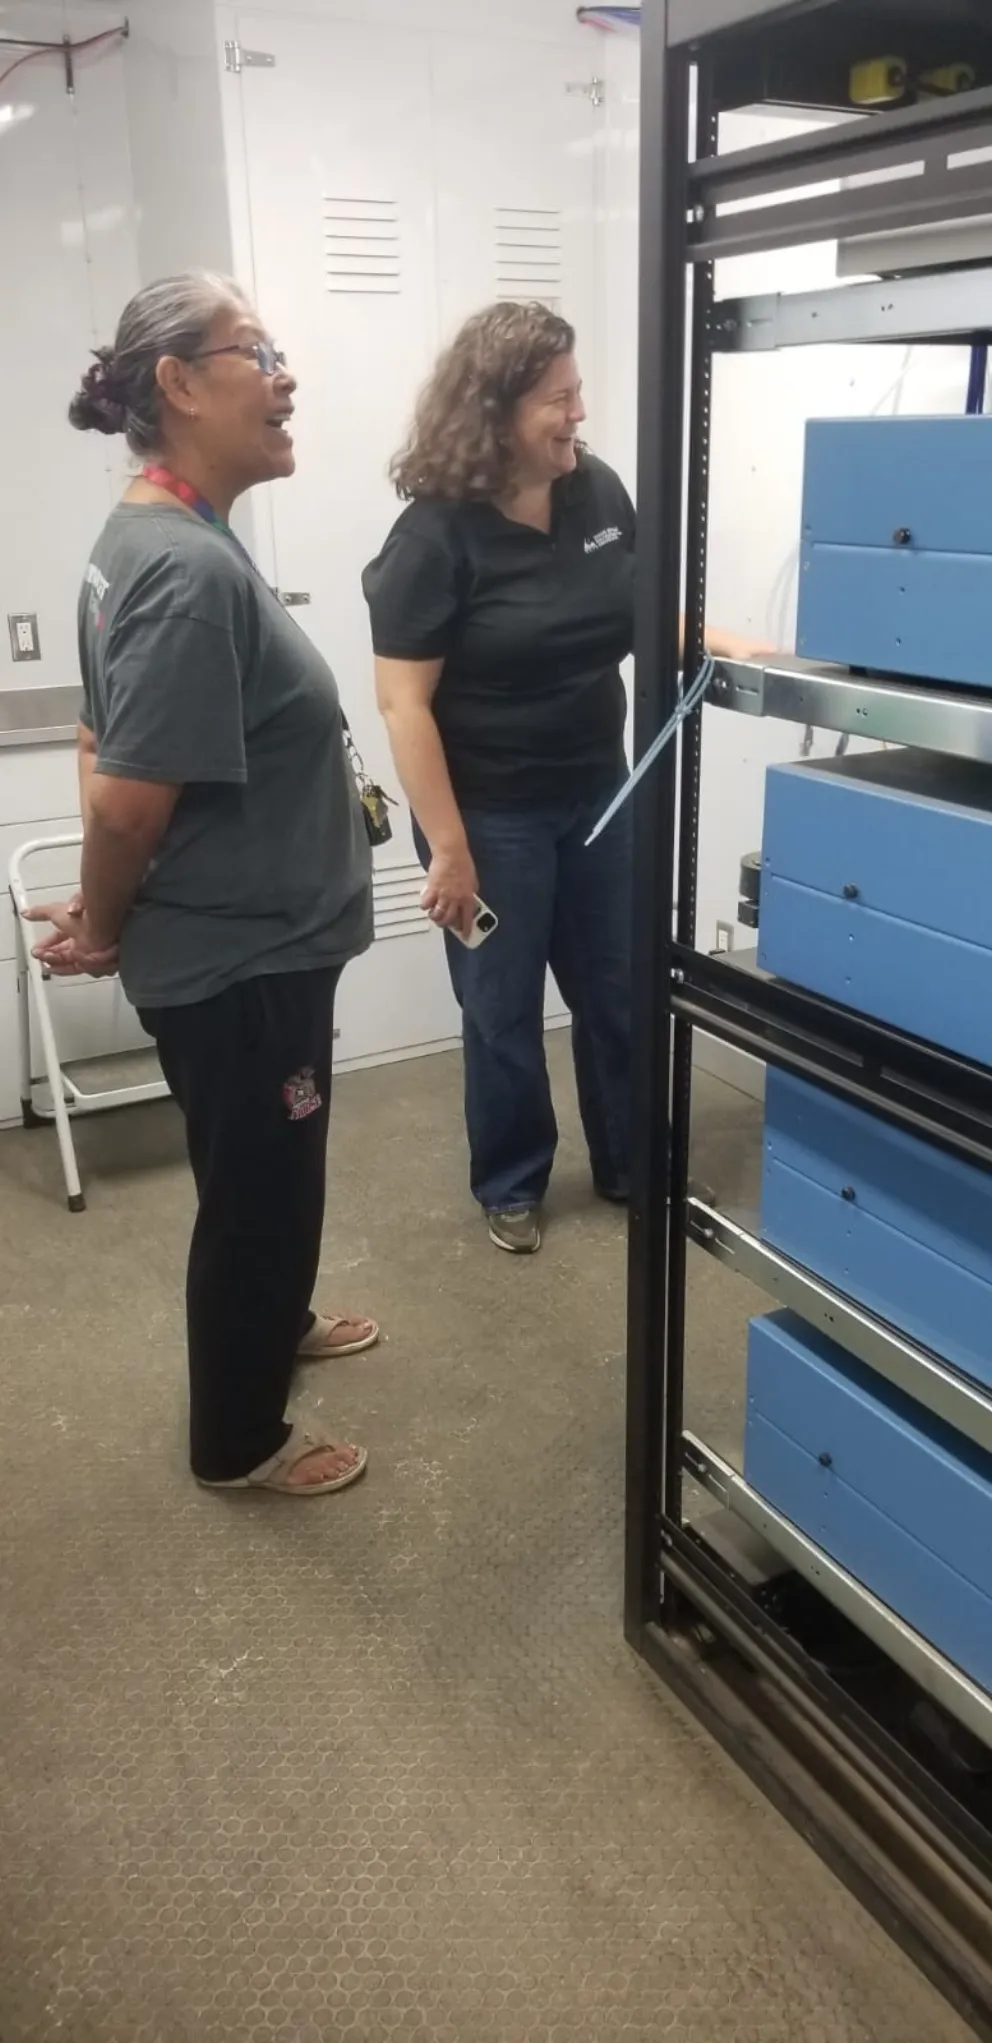
Partnerships with Indigenous communities were strengthened through meaningful actions, including the WBEA’s attendance at various community events, and by supporting community organizations. See the Community Snapshot sections in this report for more information on the engagement and events where the WBEA participated or supported.
The TIKC is composed of Indigenous community representatives, including Elders, youth, and community members, along with representatives from industry and government.
This year, through participation in workshops and information sessions, committee members developed a stronger understanding of the WBEA’s monitoring programs and regional air quality monitoring.
In 2025, the group met quarterly, offering key insights on data-sharing methods and providing valuable input into the development of the WBEA’s Forest Health Monitoring Ecological Observation Reports. The TIKC looks forward to continuing to identify opportunities to reflect community concerns, values, and priorities within WBEA monitoring programs.
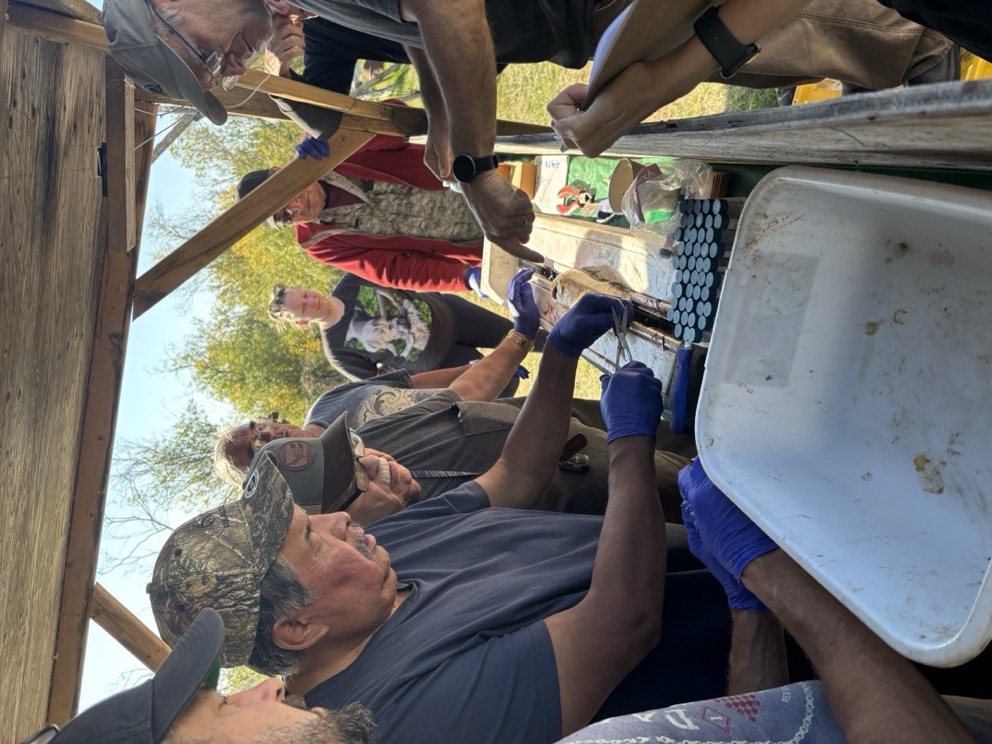
The WBEA FHM workshop series is intended to provide members with an understanding of the program and to assess whether the program is meeting current member needs. This year, the WBEA hosted two workshops with its members. The first was at the WBEA Centre where the 2024 field campaign was discussed, and the second was held in the field at a FHM site and highlighted sampling techniques used by the WBEA and shared key findings from the program. Over 30 participants—representing nine Indigenous communities, four industry organizations, and two government organizations participated in the workshops.
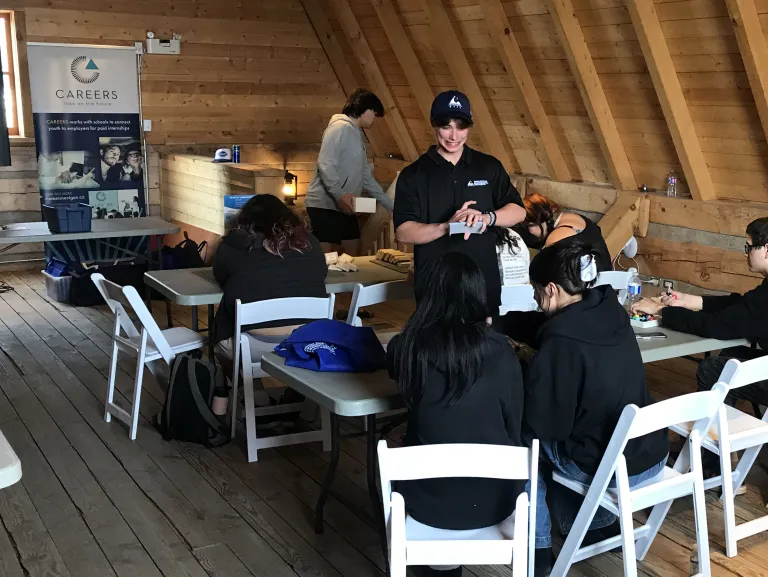
The WBEA remains committed to engaging youth in the region. Indigenous youth participate at the TIKC, and as members of field teams involved in sample collection.
As a partner of CAREERS The Next Generation, the WBEA attends various youth events, providing opportunities to share the importance of air quality and air quality monitoring initiatives in the region. In 2025, the WBEA offered an Indigenous Youth Summer Internship for its fourth consecutive year. This internship provides youth with exposure to a variety of environmental-related careers and offers hands-on experience in the field, lab, office, and external engagement activities.
The WBEA operated approximately 30 ambient air monitoring stations (AMS) throughout the region in 2025, which serve various monitoring purposes.
The Ambient Air Monitoring (AAM) Program functions to address multiple objectives, scientific questions, and requirements set by global, national, provincial, and regional jurisdictions. The WBEA’s website highlights each of these requirements specifically and how they relate to the WBEA’s monitoring network activities.
When ambient concentrations of any air pollutant the WBEA measures exceed the Alberta Ambient Air Quality Objectives and Guidelines (AAAQOs & AAAQGs), which are set provincially, the WBEA has an Immediate Reporting Protocol that is put into action.
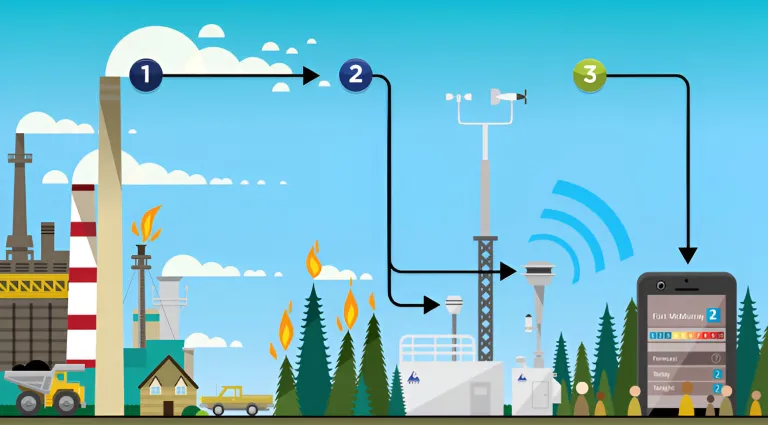
Pollution is emitted into the air from a variety of sources.
The WBEA ambient air monitoring stations measure the concentrations of pollutants in the air.
The information the WBEA collects is available to view and is used to calculate the Air Quality Health Index (AQHI).
The image below demonstrates how the WBEA collects ambient air data through continuous analyzers and time-integrated samplers to ensure residents, partners, and stakeholders have the information they need to make informed environmental decisions.
The WBEA’s ambient air quality data is compared to several established air quality thresholds, triggers, and limits. Air Quality Events represent a deviation from standards set as the Alberta Ambient Air Quality Objectives (AAAQO), and indicators identified as the Alberta Ambient Air Quality Guidelines (AAAQG). When an exceedance occurs, the WBEA follows the guidance of the Air Monitoring Directive and reports each occurrence to the appropriate governing bodies.
The WBEA developed an Air Quality Events (AQE) app as another way to notify interested stakeholders and partners of air quality events related to AAAQOs and AAAQGs. The AQE app provides near-real time notifications when an exceedance occurs in the network and allows users to subscribe to air monitoring stations of interest. The app is available for download on iOS devices. In addition, all the historical and near real-time air quality events information are stored on the Air Quality Events Air Quality Events page of the WBEA website.
The first graph below shows the exceedances in 2025 based on station locations. The second graph presents a total count of air quality event exceedances at all WBEA ambient air monitoring stations over a five-year period for AAAQOs from 2021-2025.
Note: Values may be too small to be visible on some graphs. Hover over the graph to view specific values.
Note: Forest fire season was from March 1 – October 31, 2025
Note: Forest fire season was from March 1 – October 31, 2025.
Note: TSP data reporting began in September 2022. Dustfall data reporting began in November 2022. TRS 30-min reporting began in 2025.

The Lower Athabasca Regional Plan (LARP) has existed as an extension of the Alberta Land-Use Framework since September 2012.
The LARP air quality objective – also known as the Air Quality Management Framework (AQMF) – is to manage releases from multiple sources, so they do not collectively result in unacceptable air quality. The LARP sets out trigger levels and limits for NO2 and SO2 as described in the table below. The WBEA provides AEPA with the air quality data that is used to calculate the annual LARP triggers and limits. When a trigger is exceeded, AEPA is required to create a regional management response.
The following graphs show the annual average and hourly 99th percentile concentrations of NO2 and SO2 at each station location compared to the respective triggers and limit for each parameter. The use of the hourly 99th percentile data is a statistical measure to indicate upper limits of the data. Increases in the 99th percentile beyond the LARP triggers can be an early warning to help inform appropriate management actions to prevent future exceedances.
Learn more about LARP*Note: Data collection less than 12 months in 2025.
Meteorological parameters, including wind speed and direction, humidity, precipitation, atmospheric pressure, solar radiation, and the vertical temperature structure of the atmosphere, all impact the dispersion, deposition, and transformation of common air pollutants.
Wind rose plots provide visual context for the speed, direction, and frequency of winds, and are shown below for each WBEA community station in the network. The colours within each wind rose triangle denote the frequency of the wind speed (shown in the legend above the wind roses). Calms are shown for each station as a percentage of time that wind speeds are below 0.5 kilometers per hour (km/h).
An example of how to read a wind rose plot: the largest triangle in Fort Chipewyan wind rose shows the wind comes from the East, about 18% of the time in 2025. The olive-green colour in this triangle shows the wind was between 10 and 15 km/h about 4% of the time. Wind speeds were less than 0.5 km/h in Fort Chipewyan 0.00% of the time (calms).
Wind Speed (km/h)
Calms: 0.00%
Tower Height: 20m
0.5 - 5
5 - 10
10 - 15
15 - 20
20 - 25
>= 25
Wind Speed (km/h)
Calms: 0.00%
Tower Height: 20m
0.5 - 5
5 - 10
10 - 15
15 - 20
20 - 25
>= 25
Wind Speed (km/h)
Calms: 0.00%
Tower Height: 20m
0.5 - 5
5 - 10
10 - 15
15 - 20
20 - 25
>= 25
Wind Speed (km/h)
Calms: 0.00%
Tower Height: 20m
0.5 - 5
5 - 10
10 - 15
15 - 20
20 - 25
>= 25
Wind Speed (km/h)
Calms: 0.00%
Tower Height: 20m
0.5 - 5
5 - 10
10 - 15
15 - 20
20 - 25
>= 25
Wind Speed (km/h)
Calms: 0.00%
Tower Height: 20m
0.5 - 5
5 - 10
10 - 15
15 - 20
20 - 25
>= 25
Wind Speed (km/h)
Calms: 0.00%
Tower Height: 20m
0.5 - 5
5 - 10
10 - 15
15 - 20
20 - 25
>= 25
Wind Speed (km/h)
Calms: 0.00%
Tower Height: 20m
0.5 - 5
5 - 10
10 - 15
15 - 20
20 - 25
>= 25
Two key sampling methods are used by the WBEA for conducting high-quality ambient air monitoring within its network: continuous, which generates raw air quality data in near real-time; and time-integrated or “non-continuous”.
View parameters measured at each stationThe graphs below provide an overview of each parameter measured, including its sampling method, in 2025.
The WBEA’s continuous ambient air monitoring uses analyzers that continually measure concentrations of pollutants in the air, that is 24/7, 365 days a year. This data is readily available to anyone in near real-time on our website, wbea.org.
The data for continuous monitoring is presented in the following graphs as the annual hourly average (mean) concentrations of each parameter, along with the annual hourly 99th percentile and maximum concentrations. The annual hourly 99th percentile is used to show the high end of concentrations measured at the WBEA air monitoring stations after removing the highest 1% of events, which may be outliers.
In addition to specific compounds, all stations continuously measure temperature, relative humidity, and wind speed and direction. Data related to these parameters can be found on wbea.org.
Note: Averages may be too small to be visible on some graphs. Hover over the graph to view specific values.
* Note: The WBEA uses Portable Air Monitoring Stations to measure air quality in locations where a permanent air monitoring station does not exist. Based on regulatory requirements, ambient air quality monitoring may be required for 3, 6, or 12 months per year.
Sulphur dioxide (SO2) – SO2 is produced from the combustion of sulphur-containing fossil fuels. Sulphur dioxide in the air at high concentrations can make breathing difficult, particularly for children, the elderly, and people with asthma. SO2 reacts in the atmosphere to form sulphuric acid and acidic aerosols, which contribute to acid deposition and acid rain.
Time-integrated sampling provides more detailed examination of species present in ambient air, and supplements continuous monitoring which reports a total concentration in real time. Time-integrated monitoring methods consist of exposing sample media to the atmosphere for a period, then collecting and sending that media to a laboratory for analysis.
The WBEA's time-integrated sampling data is available at https://wbea.org/data/time-integrated-data-search/. The 2025 data for time-integrated monitoring methods is presented in the graphs below as the annual average (mean) of 24-hour sample concentrations, along with the 95th percentile to show readings on the high-end of the data collected, after removing the highest 5% which may be outliers. There are numerous species collected, however, the graphs show the nine (9) or ten (10) parameters with the highest concentrations in 2025.
Note: Select which parameter you would like to view, and then use the drop-down menu to select an air monitoring station.
Note: Averages may be too small to be visible on some graphs. Hover over the graph to view specific values.
Note: Forest fire season was considered to be from March 1 – October 31, 2024.
Particulate matter less than 2.5 µm - Ions - Particulate matter consists of a mixture of solid particles and aerosols found in the air. PM2.5 is the fraction of total particulate that are 2.5 μm (microns) in diameter or less, and is produced mainly by combustion processes, including forest fires.
Typically, exceedances of the PM2.5 AAAQO in the WBEA network are a result of forest fires. Fine particles are composed primarily of sulphate, nitrate, ammonium, inorganic and organic carbon compounds, and heavy metals. PM2.5 poses a health risk as the particles can be inhaled deep into the lungs.
The continuous analyzer measures the concentration of particulate matter in the air at any given time. A time-integrated PM2.5 sample is a measure of dry deposition and is analyzed for major ions similar to the wet deposition samples, and metals that make up the particulate matter in the air.
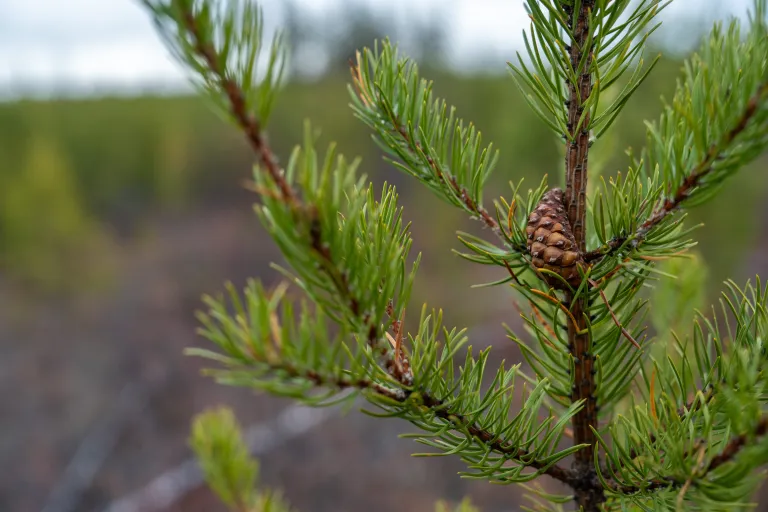
Also referred to as the Terrestrial Environmental Effects Monitoring (TEEM) Program, this initiative was established in response to concerns from communities, industry, and government about the impacts of industrial development on regional forests. Its primary objective is to identify the effects of air pollutants on forest ecosystem health in the region.
To achieve this, the WBEA operates two complementary long-term programs: Forest Health Monitoring (FHM) Program and an Atmospheric Pollutant Deposition Monitoring Program. Together, these programs monitor air pollution and deposition (the stressors), as well as their potential impacts on jack pine forest ecosystems (the effects).
Integrated analysis of data from both programs is essential. Key areas of focus include regional and temporal changes in deposition and their effects on jack pine forests. The WBEA emphasizes accessible data, information sharing, and continuous adaptation to meet the evolving needs of its members. These programs continue to be built on collaboration to ensure monitoring is both scientifically rigorous and grounded in local knowledge.
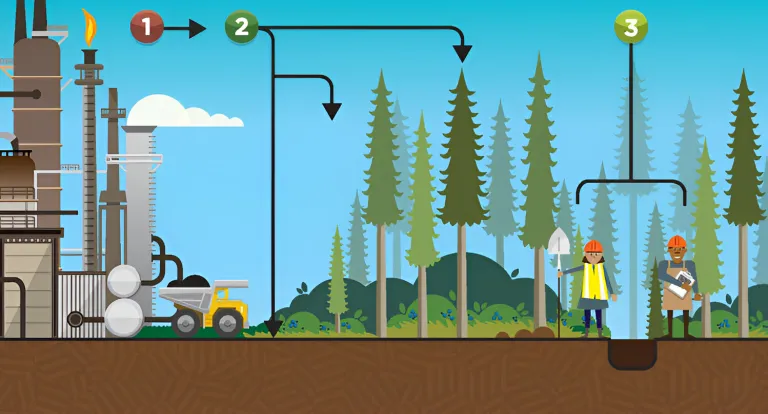
The image below demonstrates how the WBEA collects samples and information to measure the effects of air pollution.
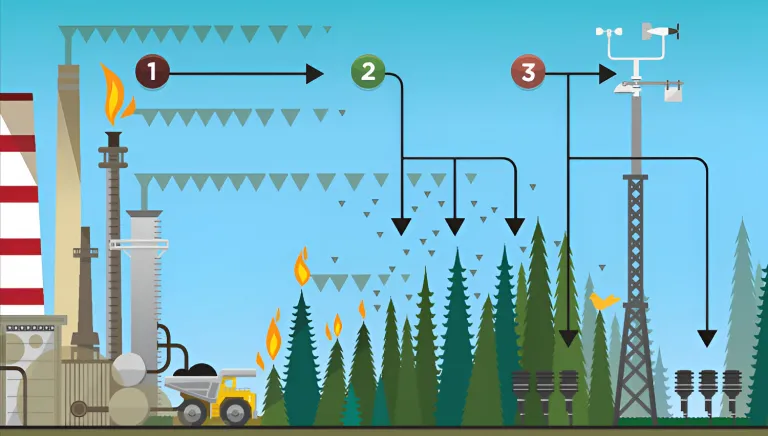
Pollution is emitted into the air from a variety of sources.
The pollution may be deposited onto the surrounding environment.
The WBEA collects samples to measure the amount of pollution deposited into the enviroment.
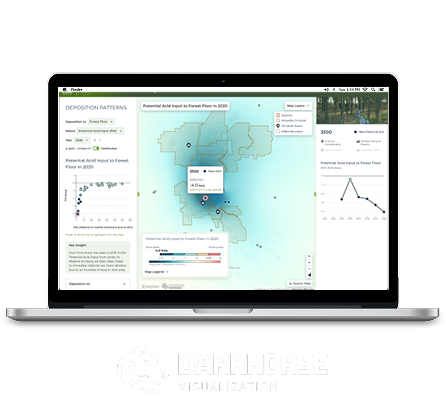
The WBEA has launched a new initiative: the Deposition and Forest Health Monitoring Website. This website will bring together data collected from the Deposition Monitoring and Forest Health Monitoring Programs.
In this first phase of the website, interactive charts and maps were developed to provide insight on how deposition patterns have changed over time both at individual monitoring sites and across the region.
View the new Deposition and Forest Health Monitoring Website
The FHM Program conducts intensive sampling campaigns every six years across jack pine (Pinus banksiana) forest sites. These campaigns include soil, vegetation, and lichen sampling to assess ecosystem health.
The upland jack pine within the region was selected as the primary focus as it grows in sandy soils with limited buffering capacity to acid deposition.
In these ecosystems, the effects of acid deposition are expected to follow a cascading pattern—beginning at the soil level and progressing through vegetation, tree stands, and eventually the broader landscape. While larger-scale impacts may take longer to emerge, they are also more difficult to reverse.
In 2025, the FHM workshop series continued with two workshops—a winter workshop focused on reviewing the 2024 intensive field campaign, focus studies, and program development, and a fall workshop which delivered a hands-on learning experience to WBEA partners and stakeholders at an FHM site.
The image below demonstrates how the WBEA collects data about trees, plants, lichen, and soil to better understand if and how the pollution is affecting the forest.
Pollution is emitted into the air from a variety of sources.
The pollution travels in the air and may be deposited onto the surrounding forest.
The WBEA collects data about trees, plants, lichen, and soil to understand if & how the pollution is affecting the forest.
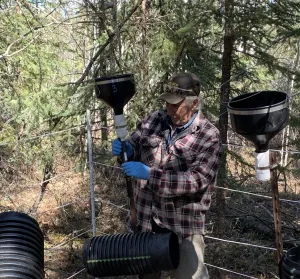
The Deposition Monitoring Program uses three primary methods to monitor pollutant deposition: passive samplers, denuders, and ion exchange resins (IERs). Combined with meteorological data, these tools help determine where and when atmospheric deposition occurs.
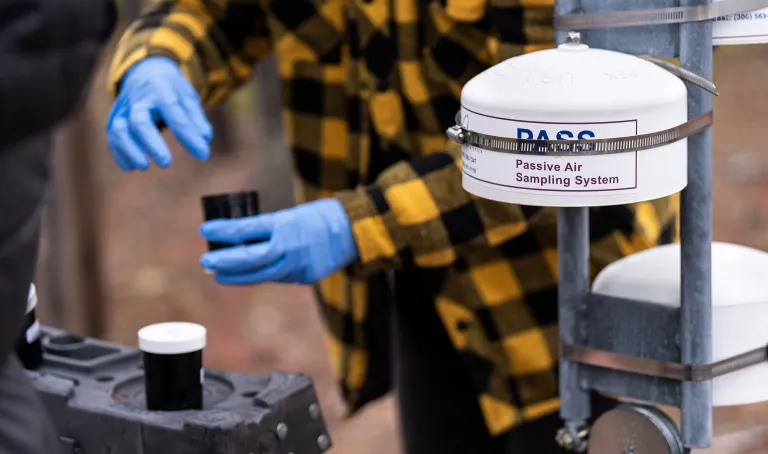
Passive air samplers are a cost-effective method for monitoring across wide and remote areas. They operate without power or moving parts and are used to support regional deposition modeling.
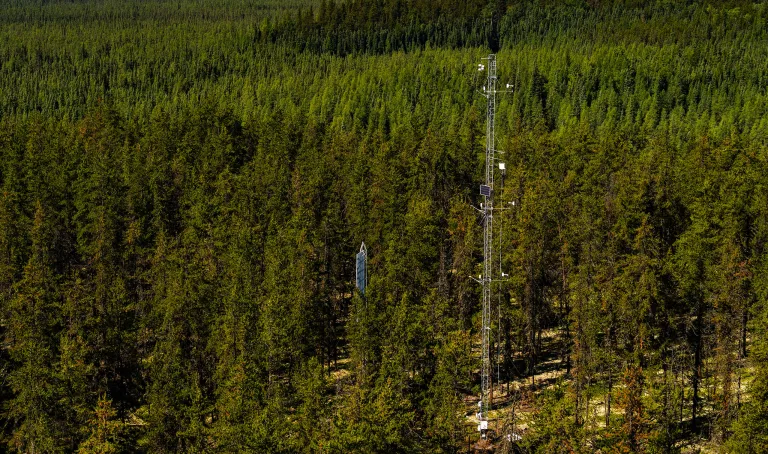
Denuders are active air samplers that draw a known volume of air through sample media or continuous analyzers using a pump. Denuders are mainly located on towers to sample air above the jack pine canopy.
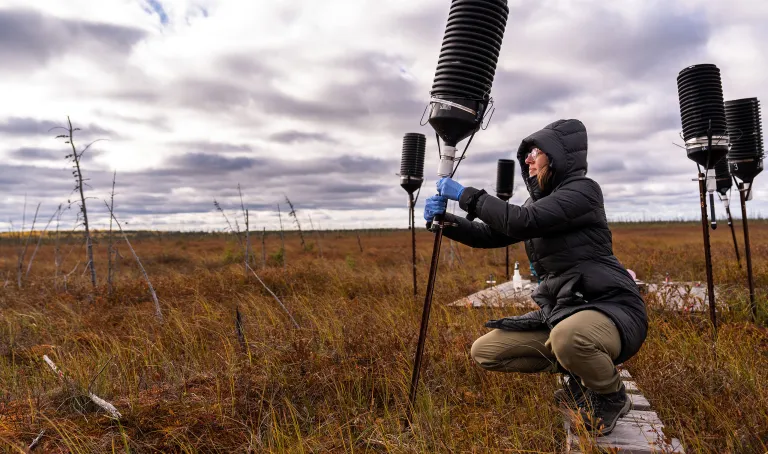
IERs are passive devices containing resin beads that capture anions (e.g., ionic nitrogen and sulphur) and base cations from precipitation.
The WBEA's regional meteorological network provides key data for calculating deposition rates, modelling dry deposition, and evaluating the performance of deterministic models. The network is comprised of six 30-meter instrumented towers ("met towers") that provide continuous, hourly data on climatic conditions throughout the Wood Buffalo region. Each met tower is co-located with a Forest Health Monitoring (FHM) site and monitors air temperature, relative humidity, wind speed, wind direction, and solar radiation at four levels within and above the jack pine canopy, as well as temperature and volumetric water content within forest soil.
The map belowadjacent map shows where each of the six 30-meter meteorological towers are located within the WBEA's network. The wind data collected from these towers, measured above the tree canopy, are used to characterize wind flow in a wider geographical area, calculate emission deposition, and evaluate ecological data. The corresponding wind roses for each tower are located below.
0.5 - 5
5 - 10
10 - 15
15 - 20
20 - 25
>= 25
Note: Meteorological data for Site 2001 are only available for part of 2025 due to impacts to the tower from the Red Earth Complex Wildfire.