To empower all stakeholders and rights holders with environmental data to make informed decisions.
We are a multi-stakeholder, consensus-based organization providing world-class environmental monitoring and reporting.
For the WBEA, 2024 was a year of meaningful and consistent growth, grounded in collaborative, consensus-based decision-making. Our commitment to transparency, inclusivity, and community engagement remained central to our work throughout the year.
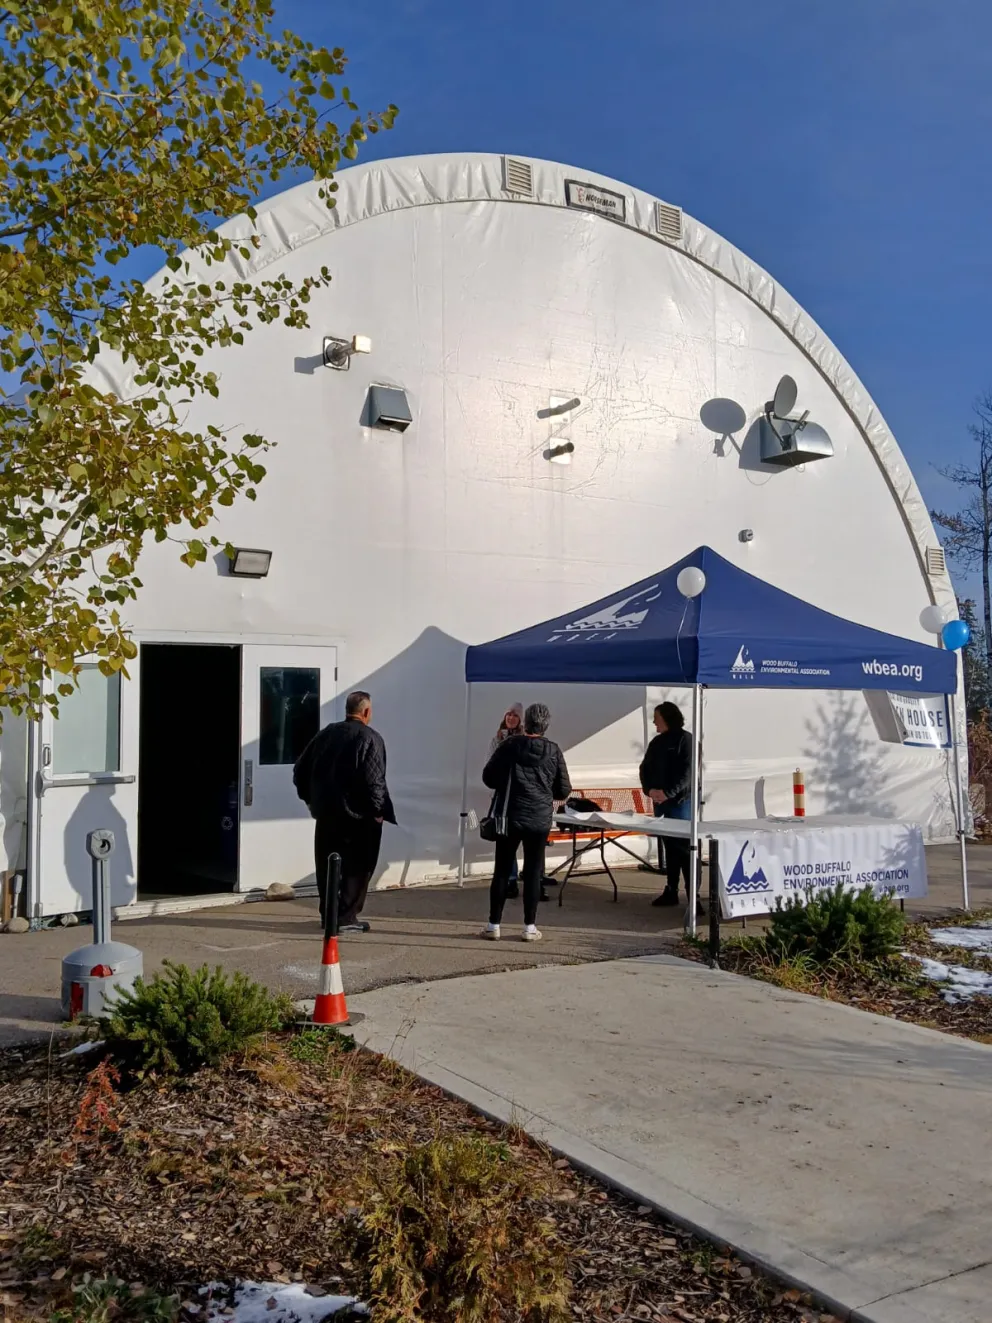
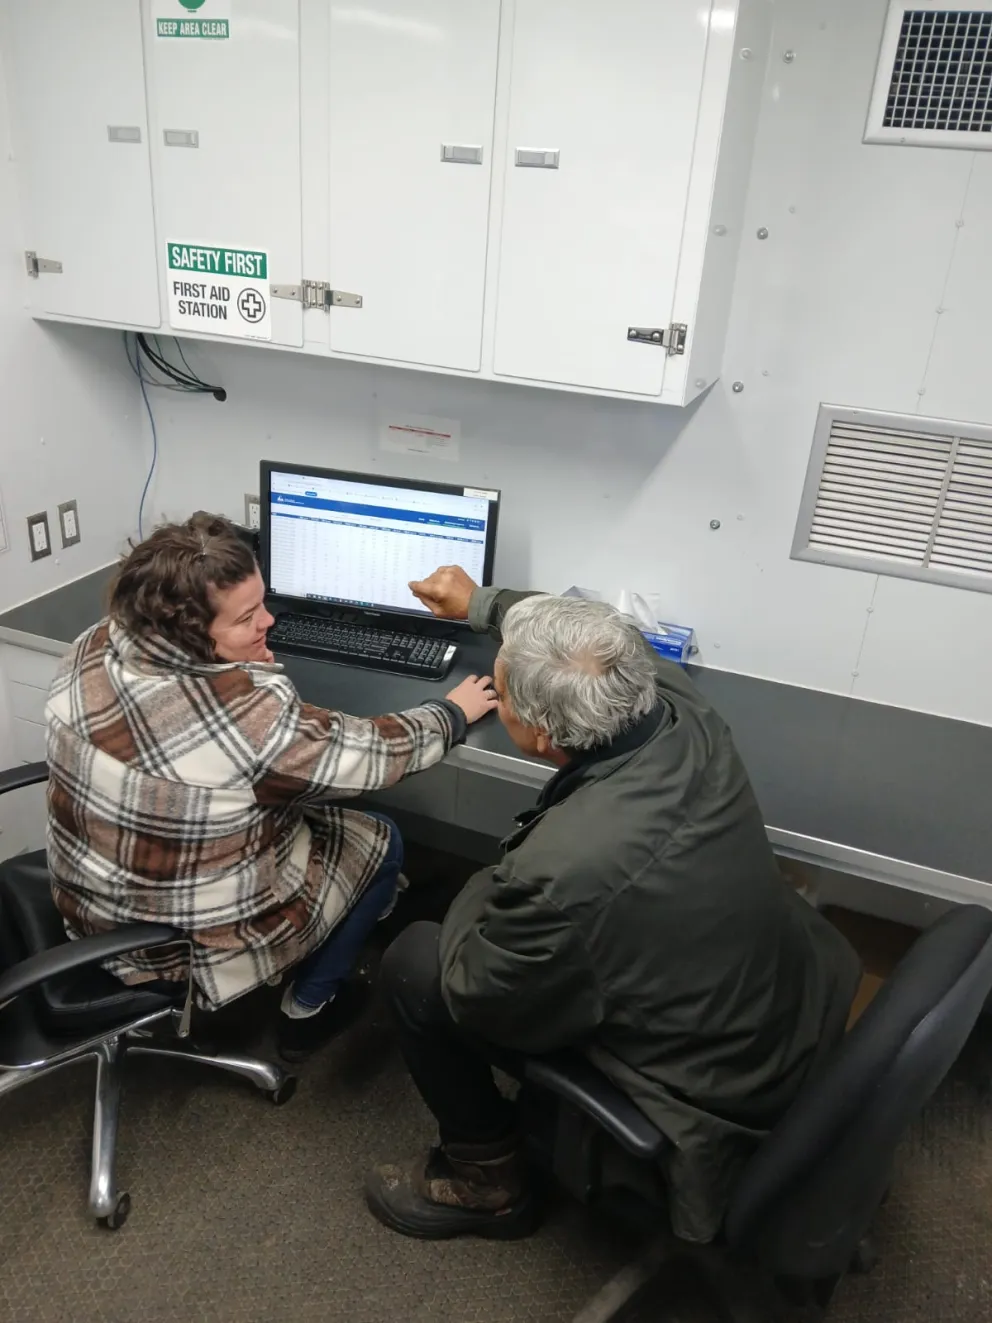
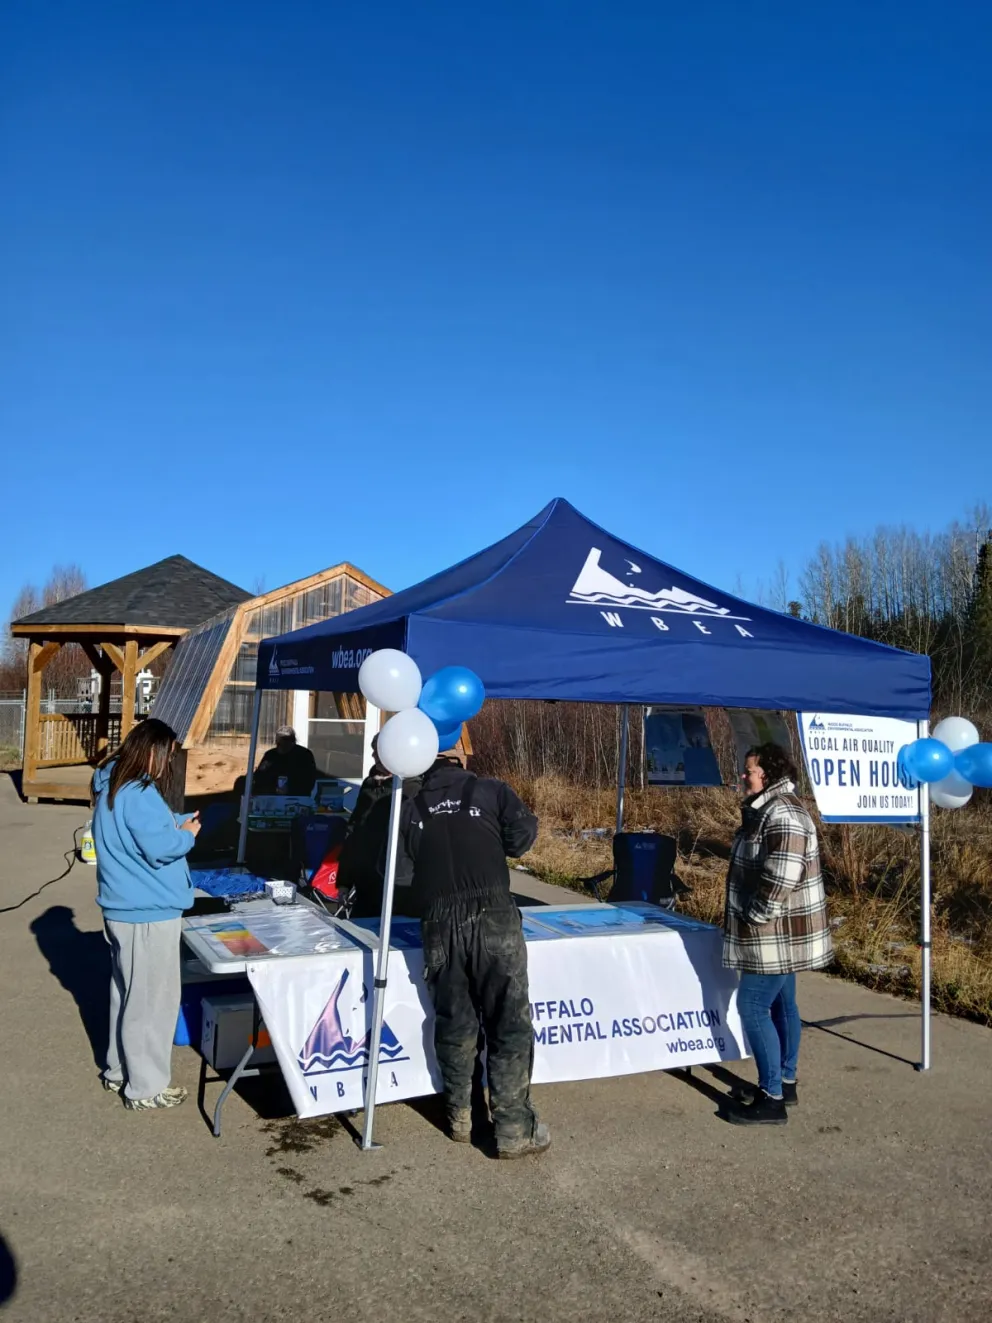
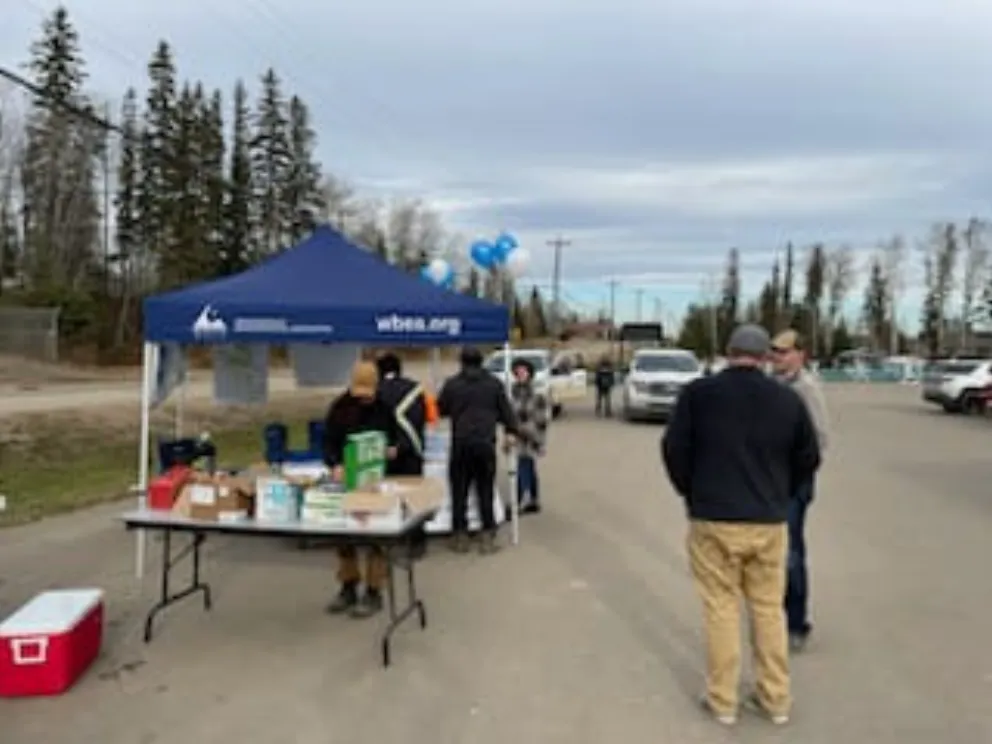
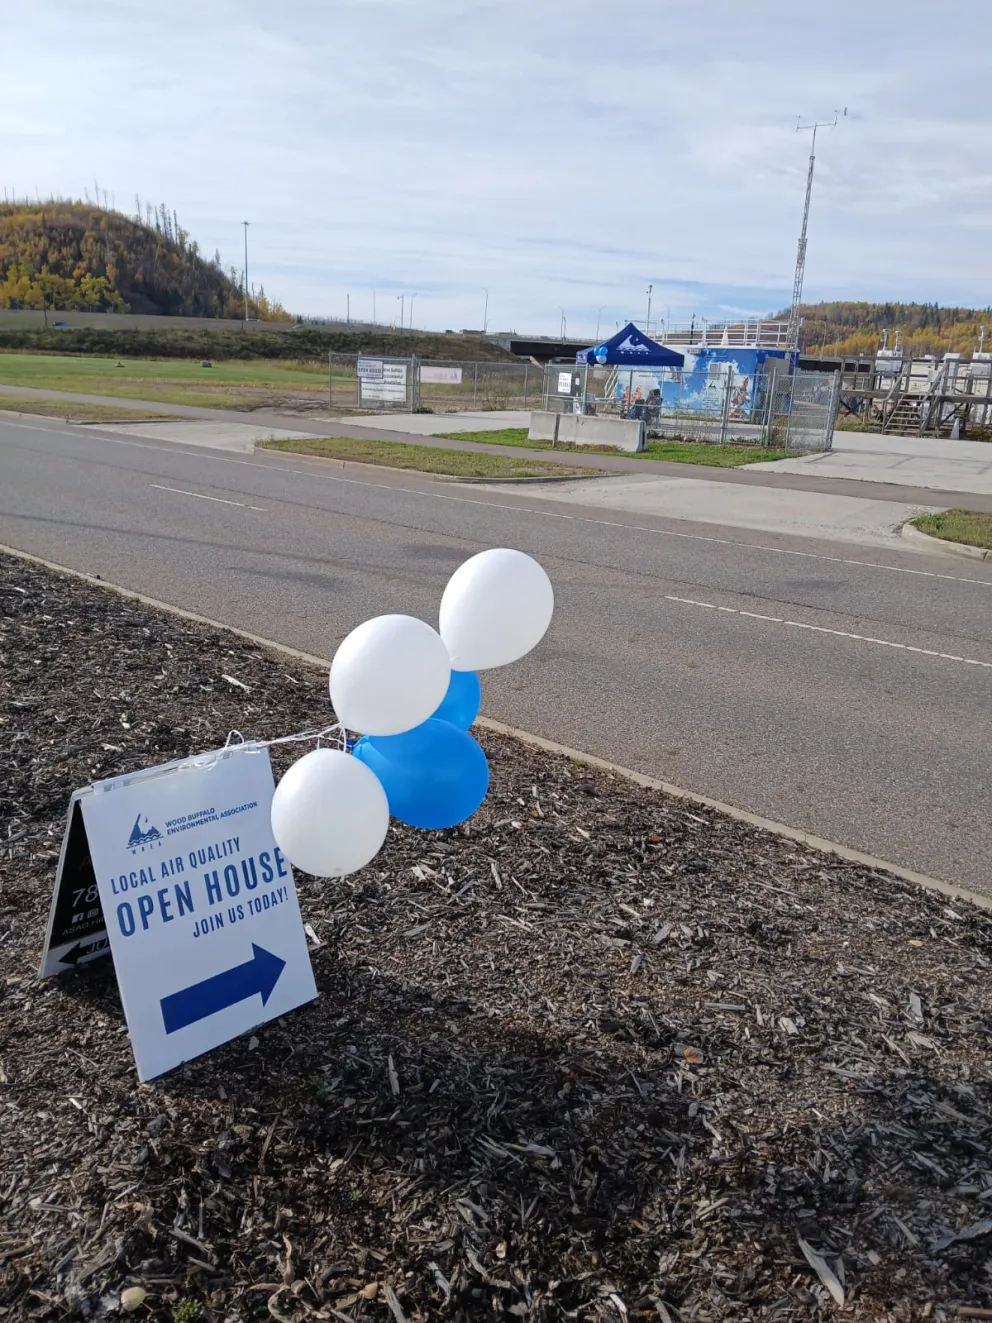
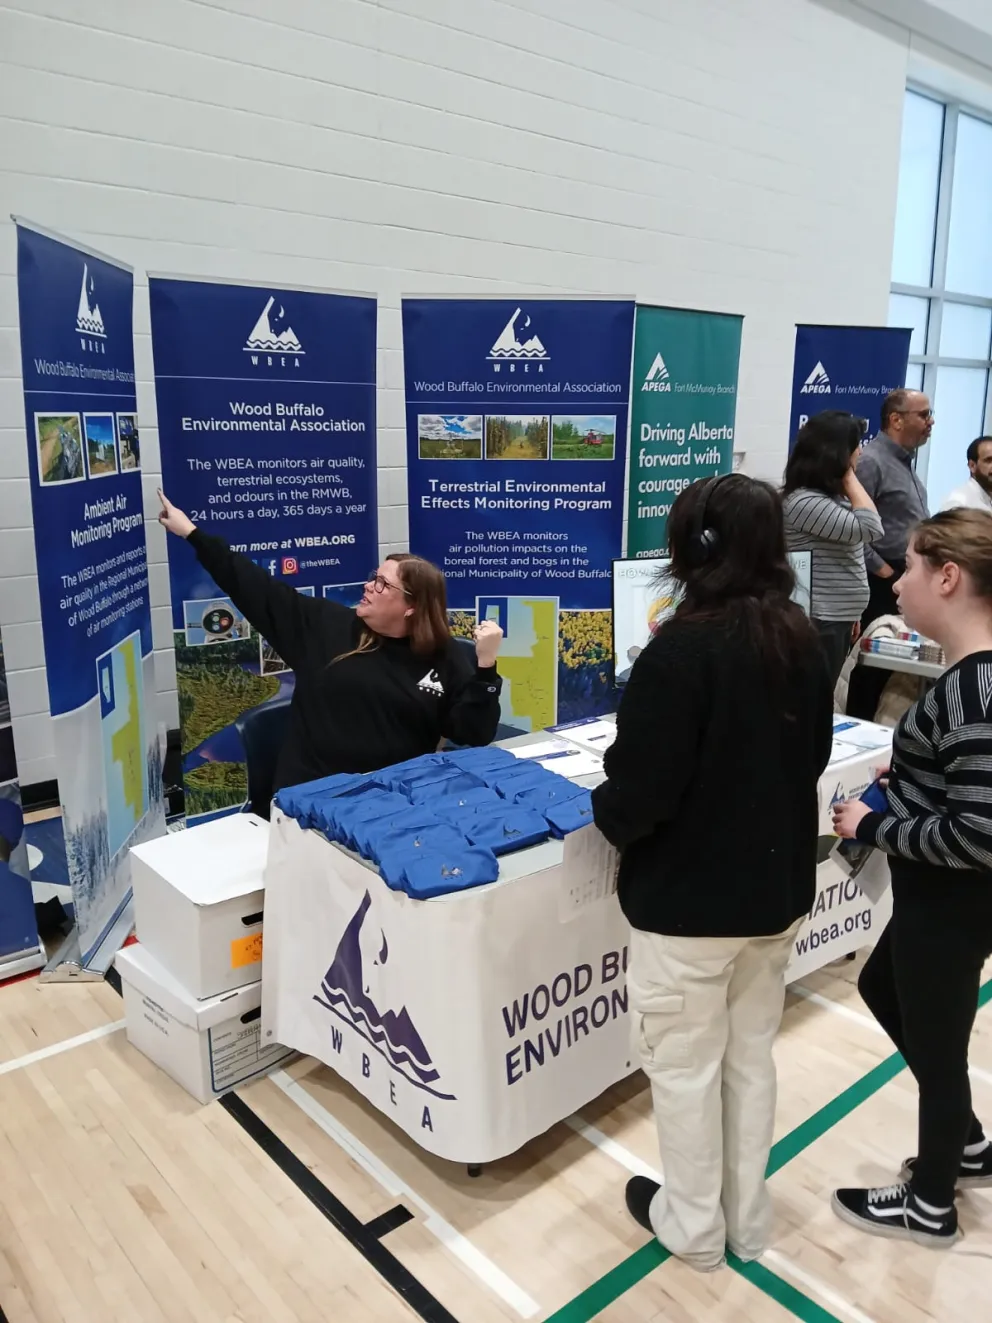
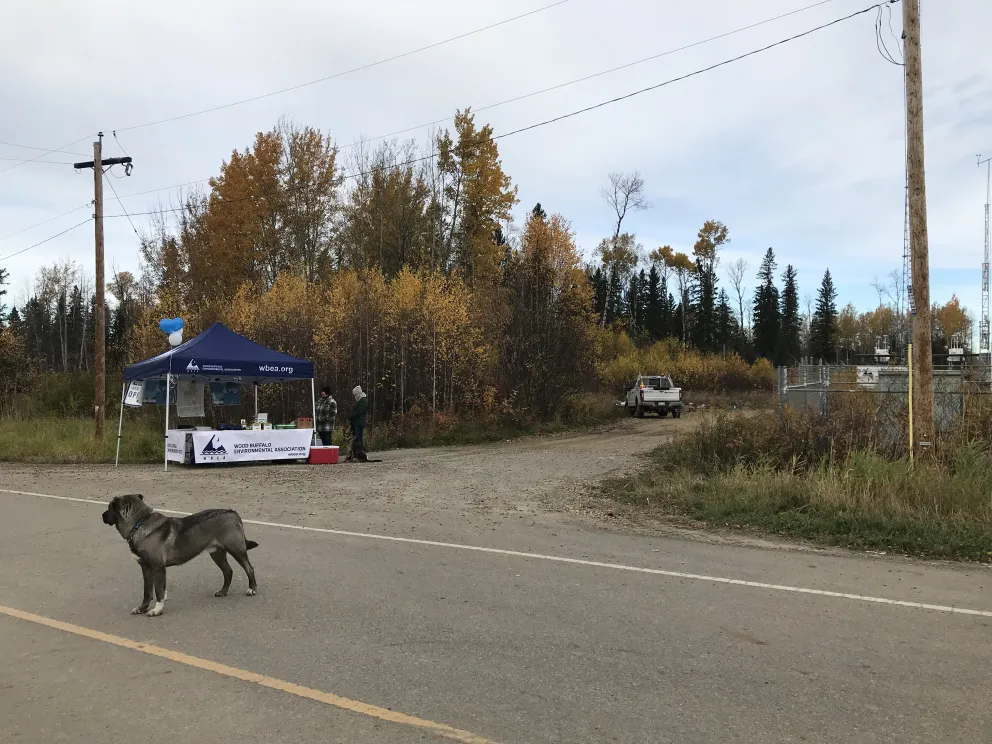
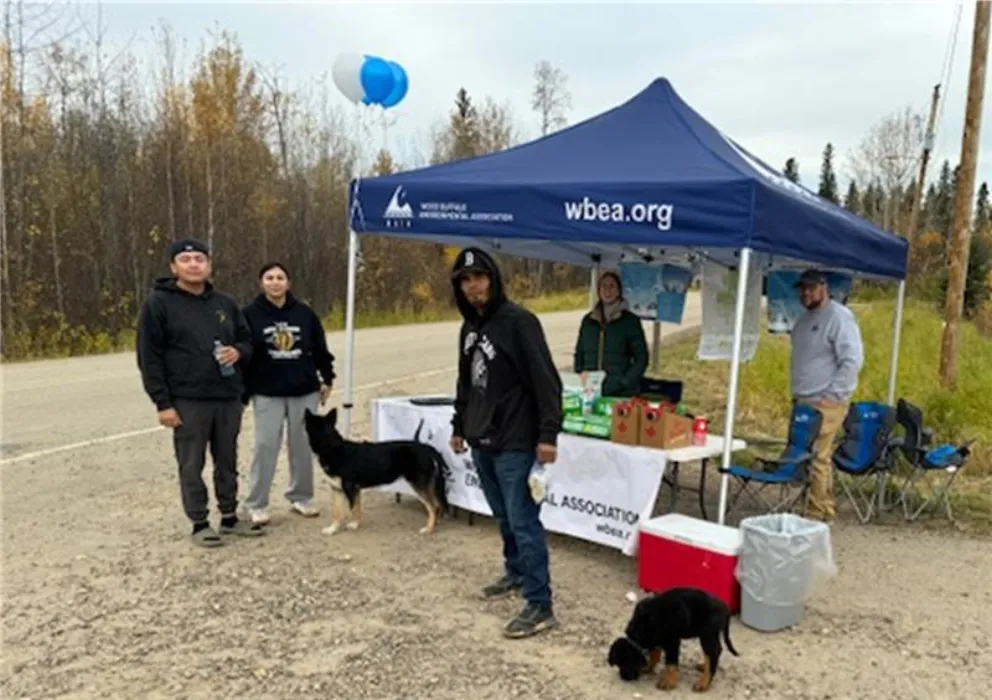
From October to December 2024, WBEA hosted six open houses across communities in the Regional Municipality of Wood Buffalo (RMWB). These events offered residents the opportunity to tour local Air Monitoring Stations and speak directly with WBEA staff about how environmental data is collected, processed, and shared.
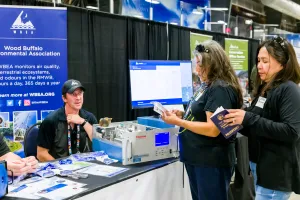
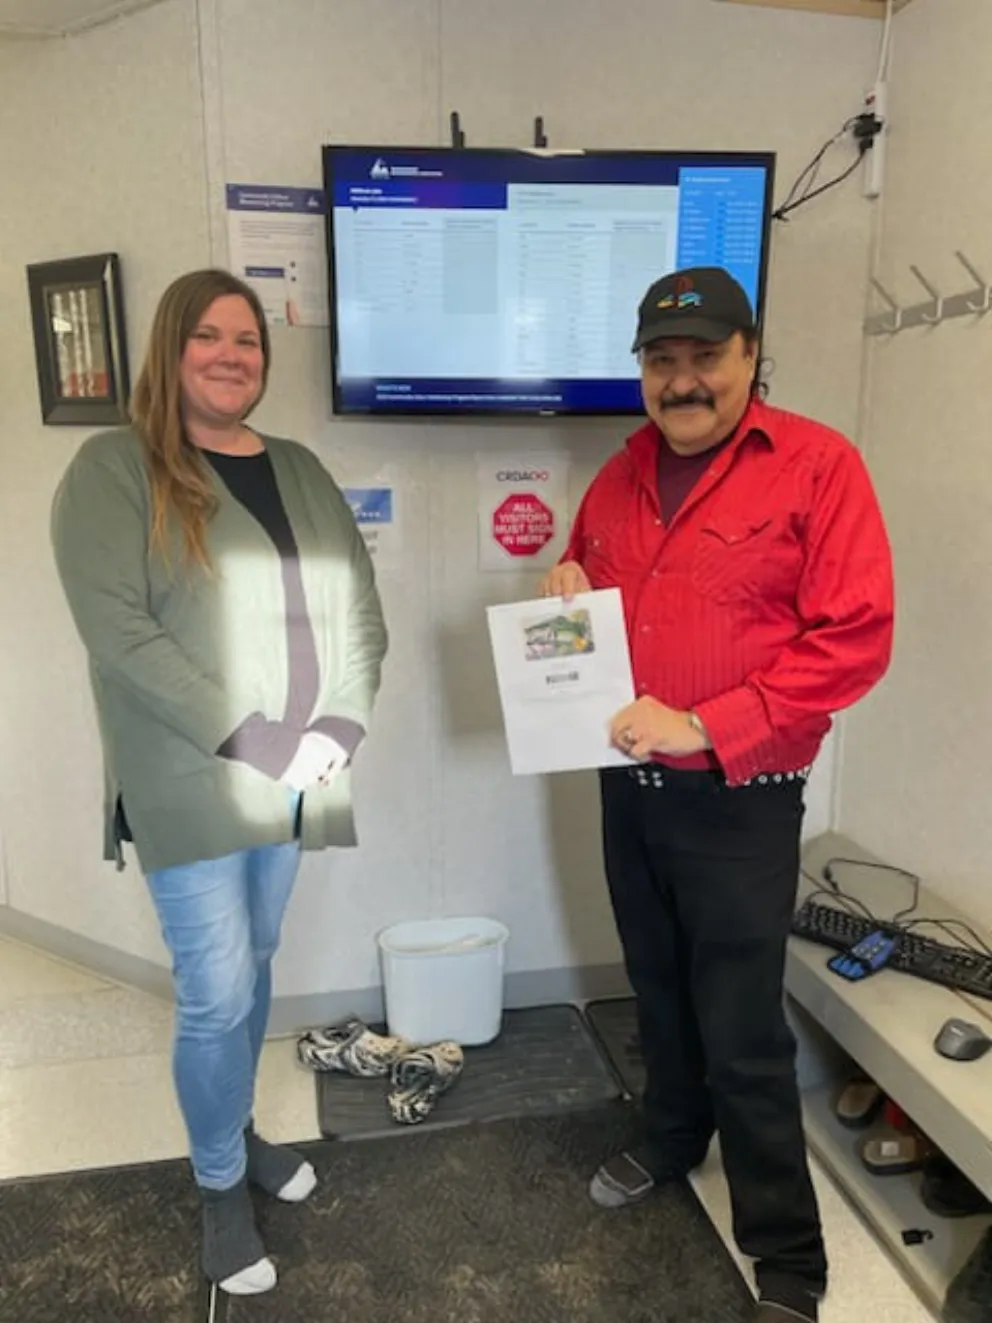
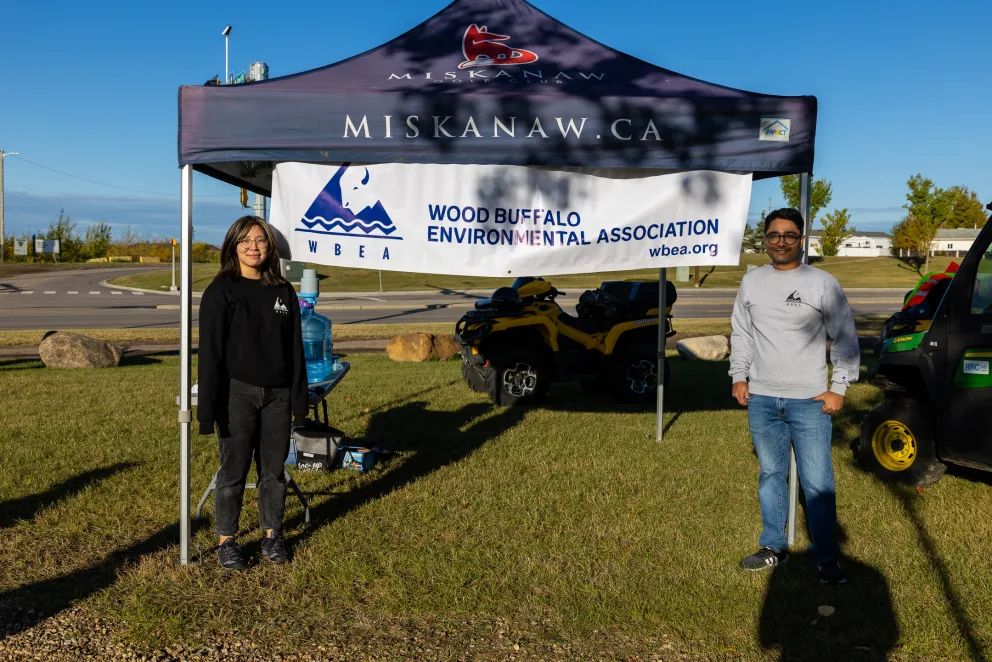
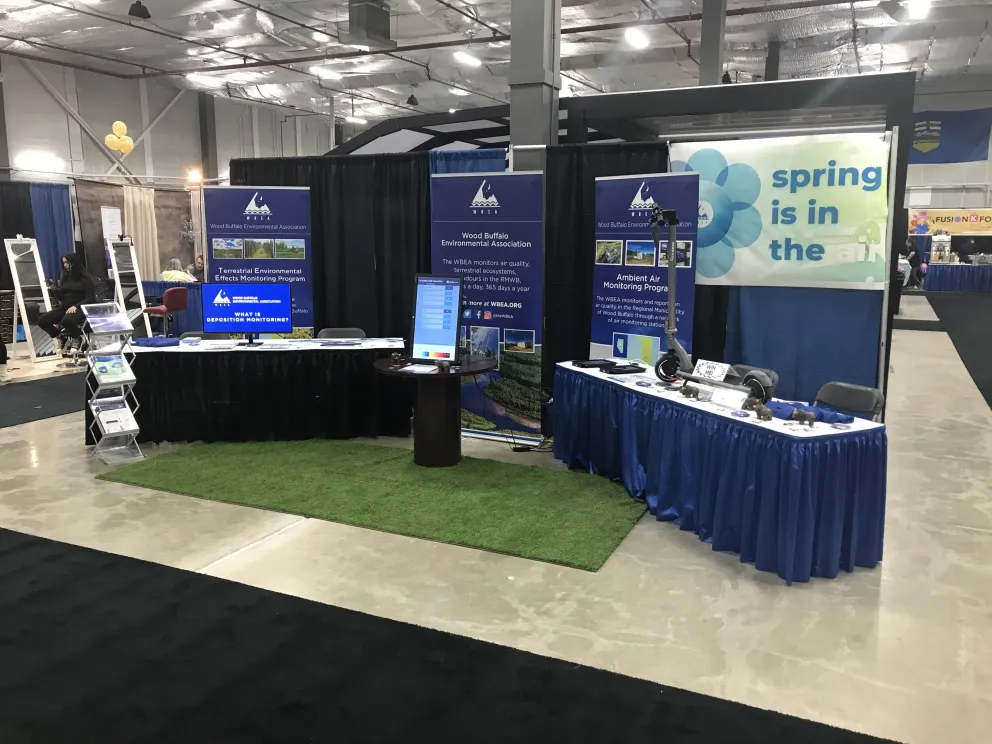
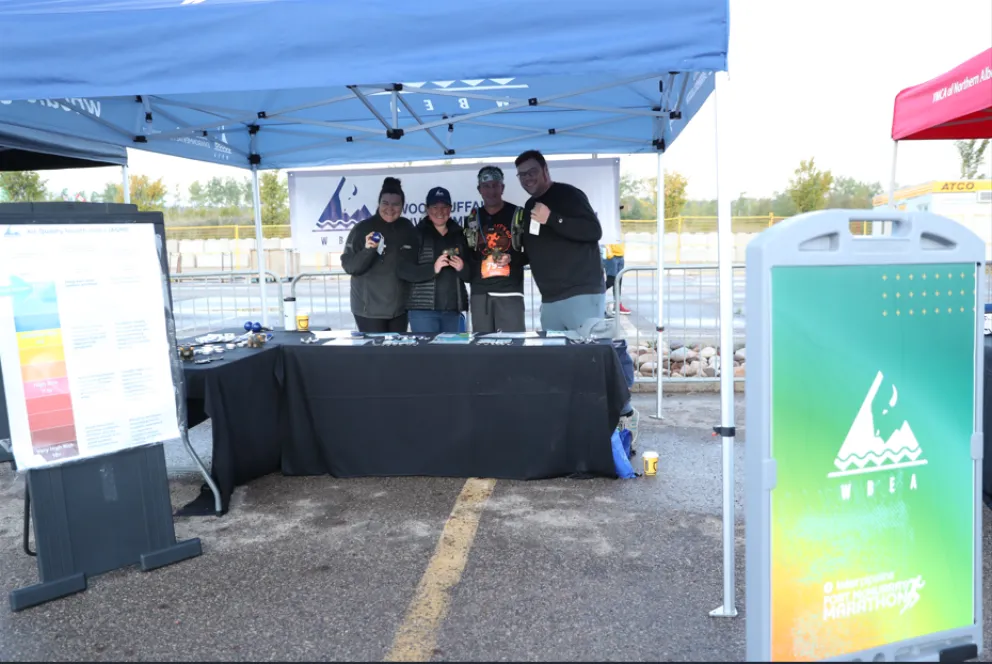
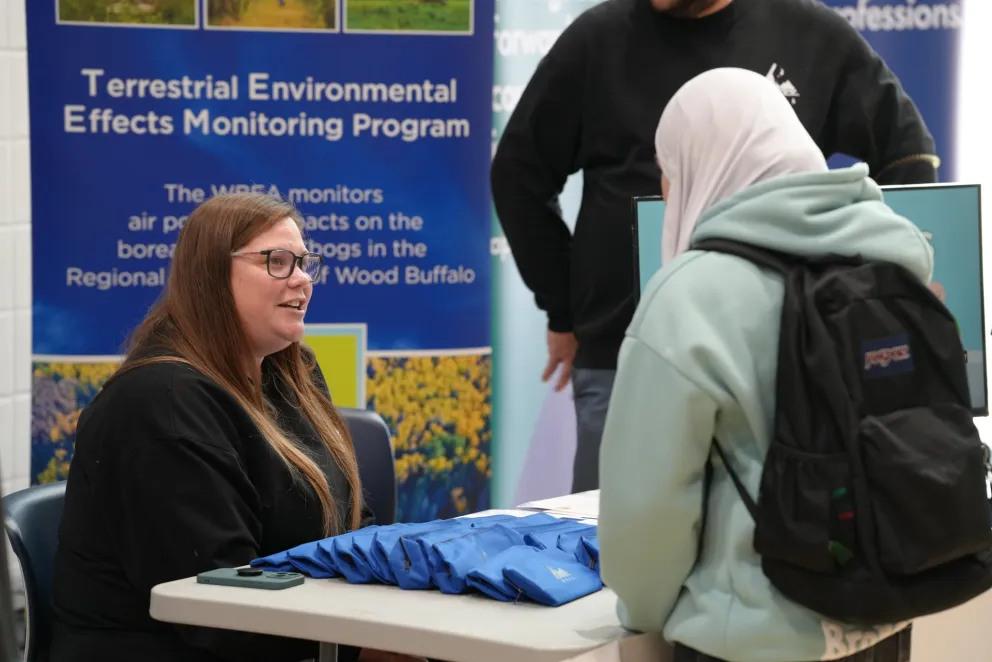
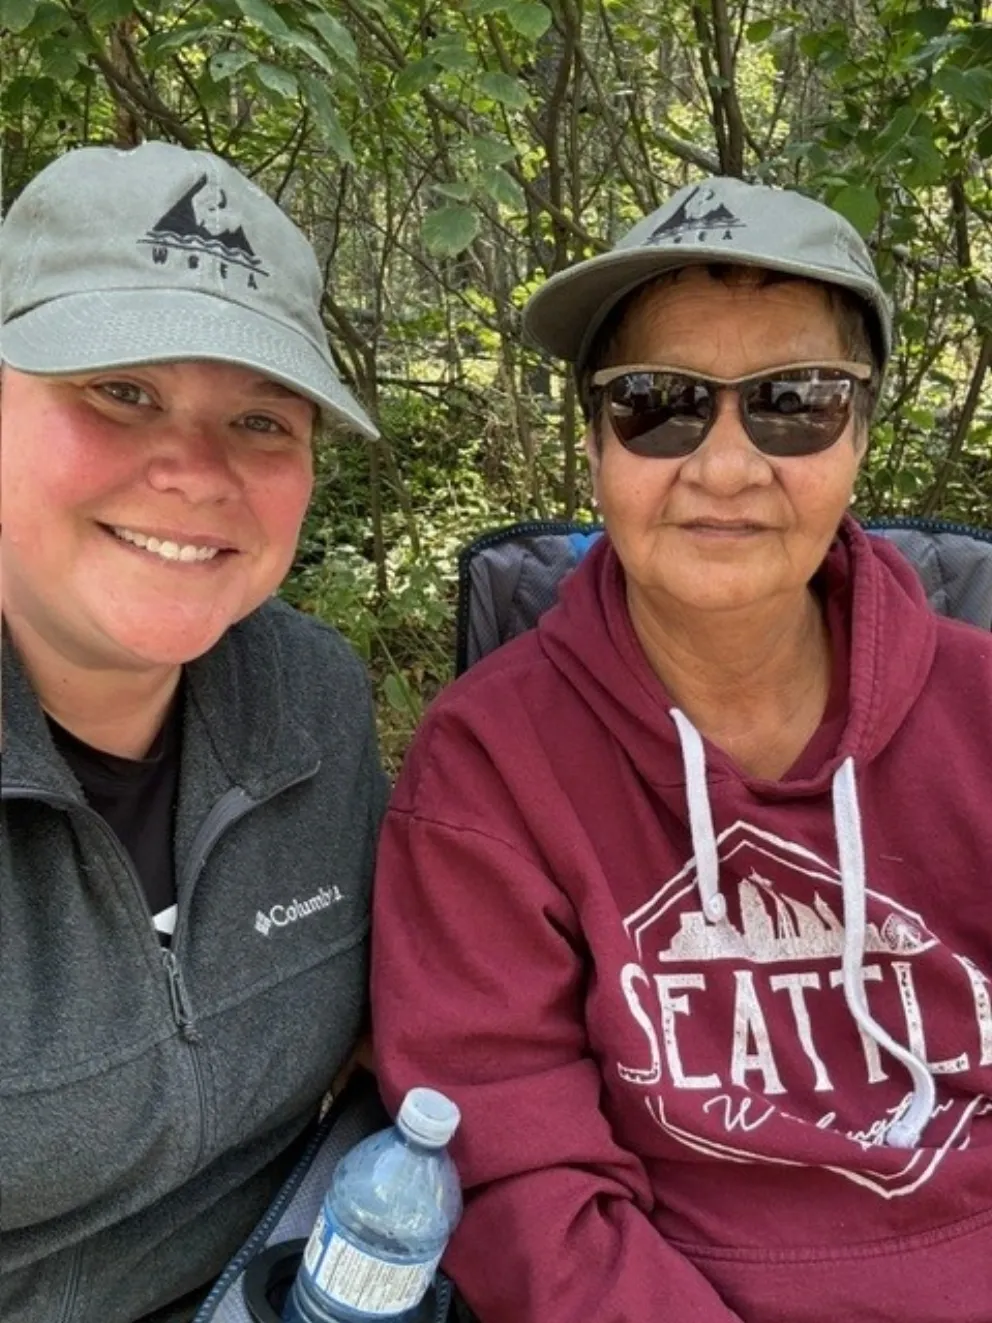
Beyond these open houses, the WBEA engaged with the public through participation in community tradeshows, career fairs, and Treaty Days events. We also shared air quality data and health information at the Fort McMurray Marathon and presented findings at the Nipîy Tu Research & Knowledge Centre’s Annual Knowledge Forum in Fort Chipewyan. In whatever form the engagement took, WBEA staff always approached these opportunities as a chance to collaborate, as well as educate.
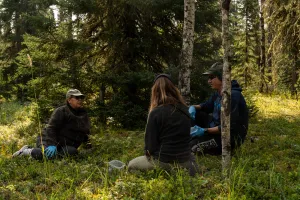
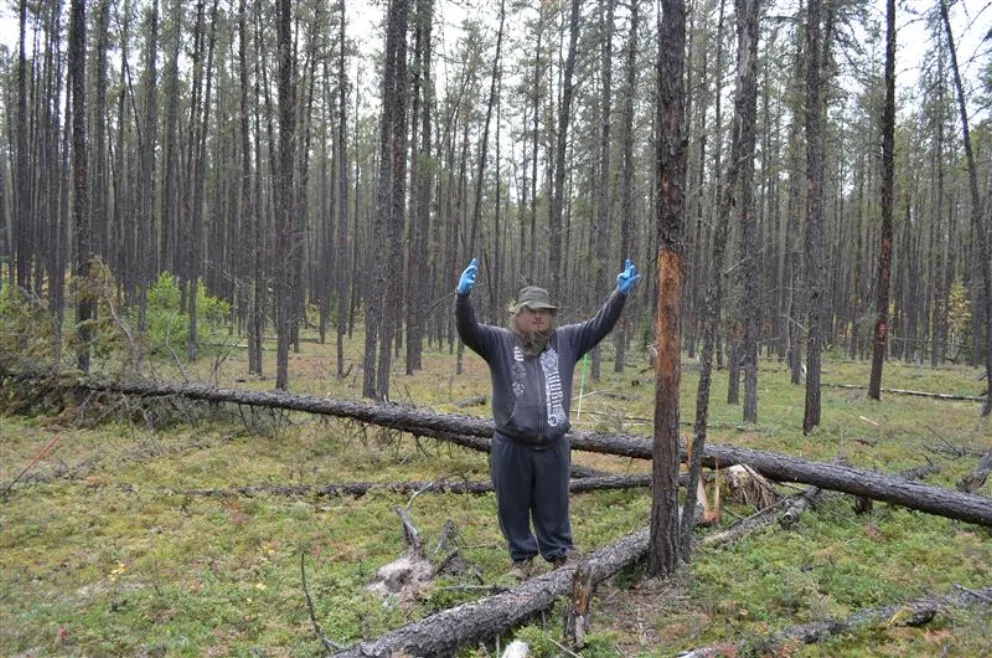
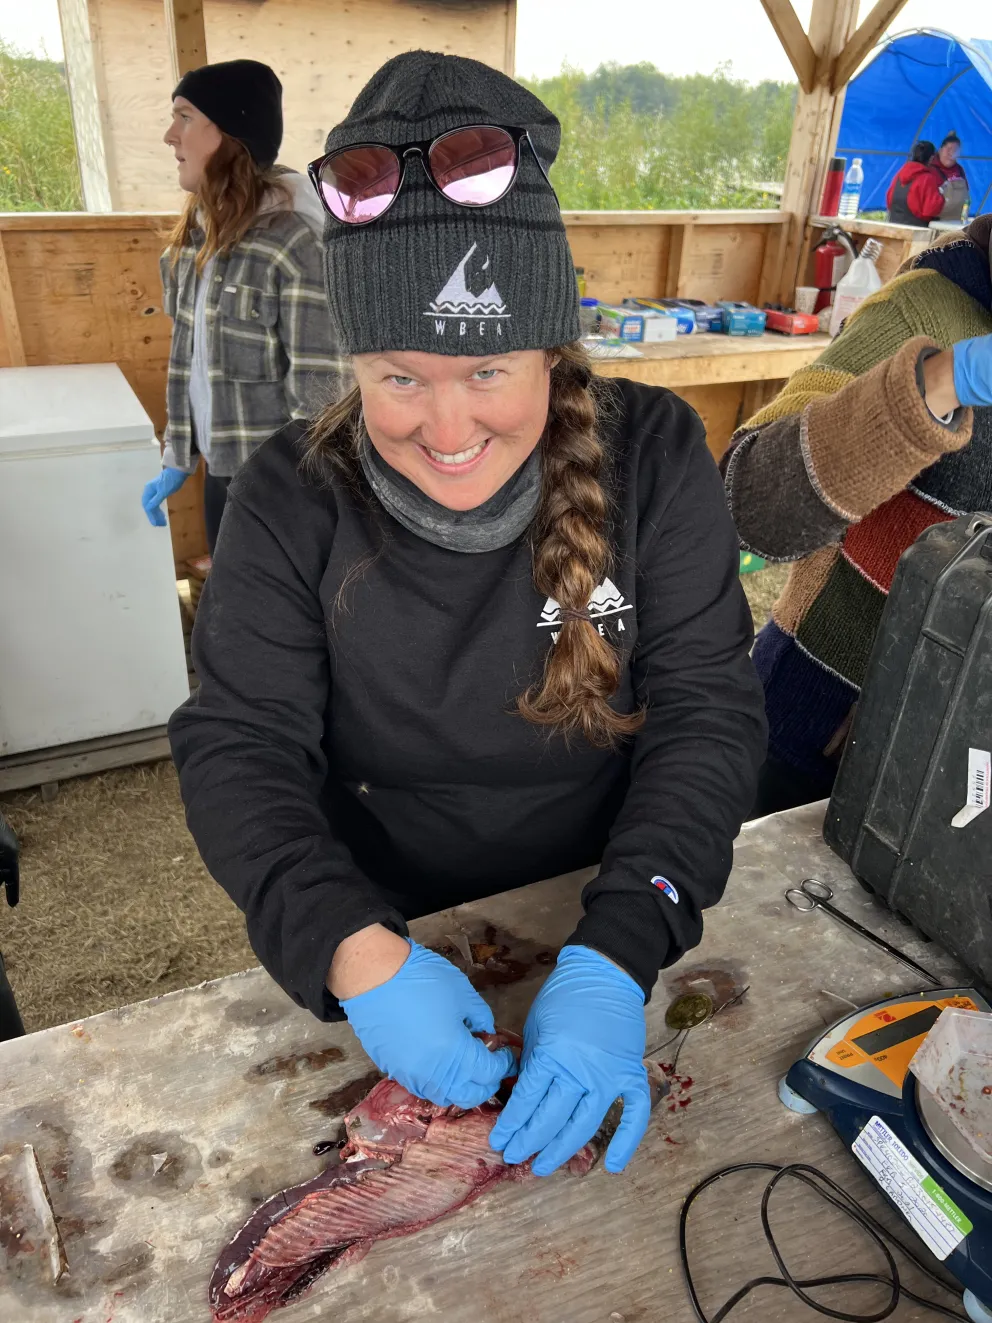
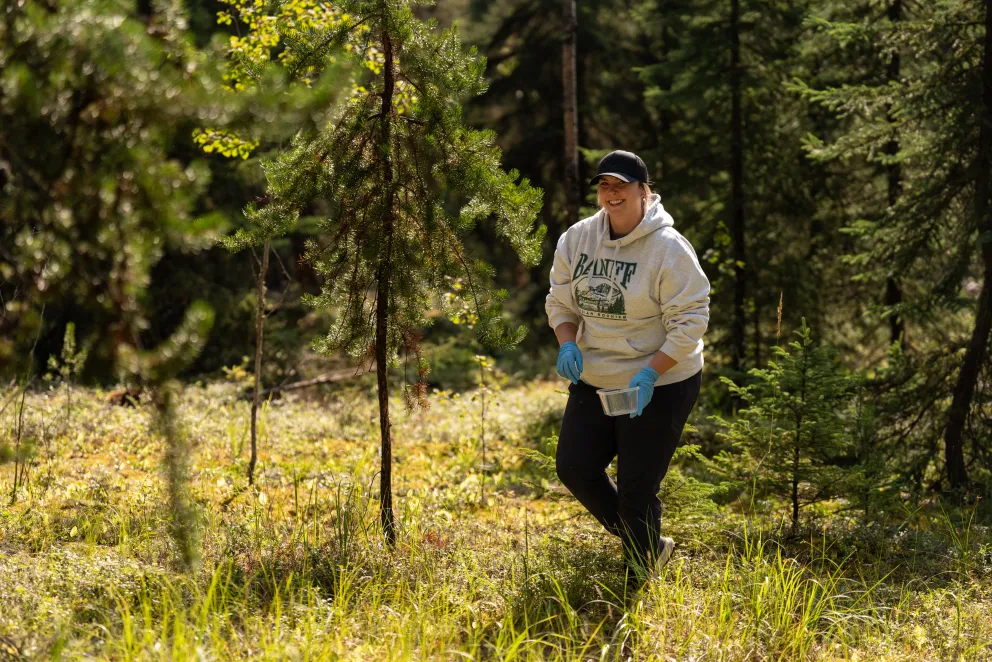
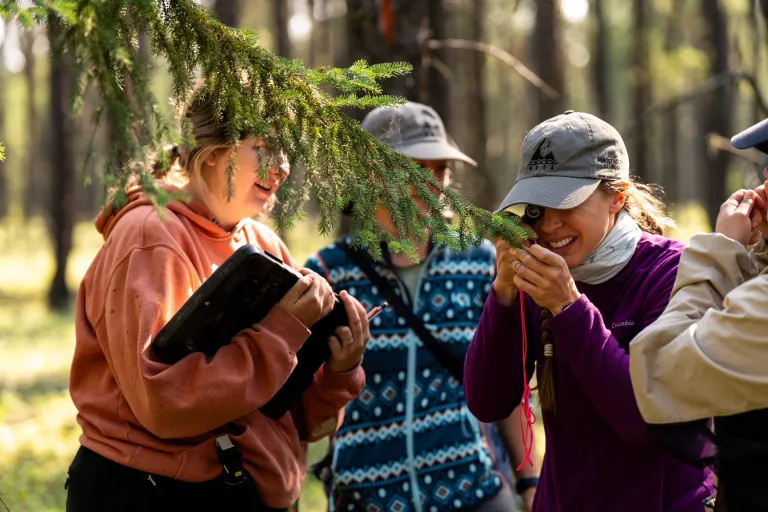
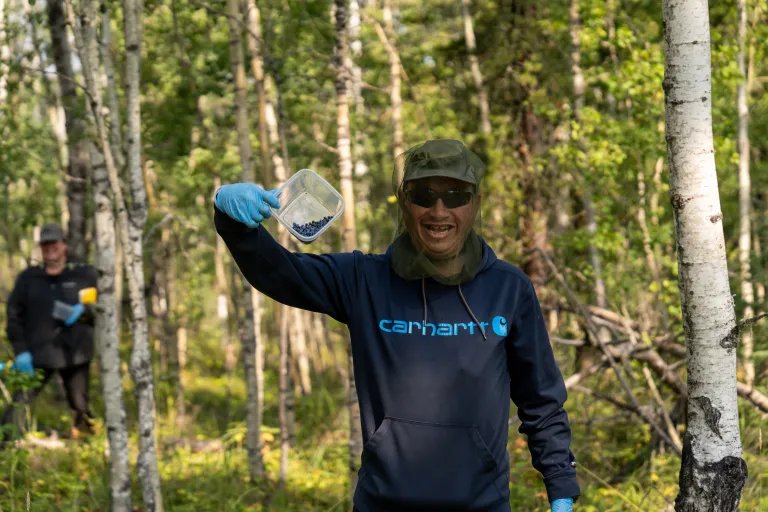
The 2024 field season marked the WBEA’s Forest Health Monitoring (FHM) program’s fifth major sampling campaign. The FHM program collects samples on a six-year cycle and combines soil, vegetation, air quality and deposition monitoring to understand effects that deposition is having in the region. Adaptations to fieldwork and monitoring indicators were informed through participation and feedback at the Forest Health Monitoring workshop series. Nine local Indigenous communities participated in field collections of blueberry and lichen samples as part of two focus studies.
The WBEA expanded deposition monitoring northward in 2024 with the addition of four new monitoring locations. This monitoring was made possible through partnerships with Athabasca Chipewyan First Nation, Mikisew Cree First Nation, and McMurray Métis.
Collaboration was the driver for the outcomes of the Network Assessment Working Group (NAWG). More than 30 participants across 10 engagement sessions, guided by external facilitators, assessed the WBEA’s monitoring network and delivered 10 key actionable recommendations at the end of 2024.
In recognition of this work, the WBEA received a gold-level Facilitation Impact Award from the International Association of Facilitators (IAF), highlighting the measurable and meaningful impact of effective facilitation and engagement.
The information in this annual report reflects the collaborative efforts of WBEA staff, members, and partners. A new feature introduced this year is the Community Snapshot section, which highlights our engagement efforts with communities in the RMWB throughout 2024.
We thank you for your continued interest in air quality monitoring in the Regional Municipality of Wood Buffalo.

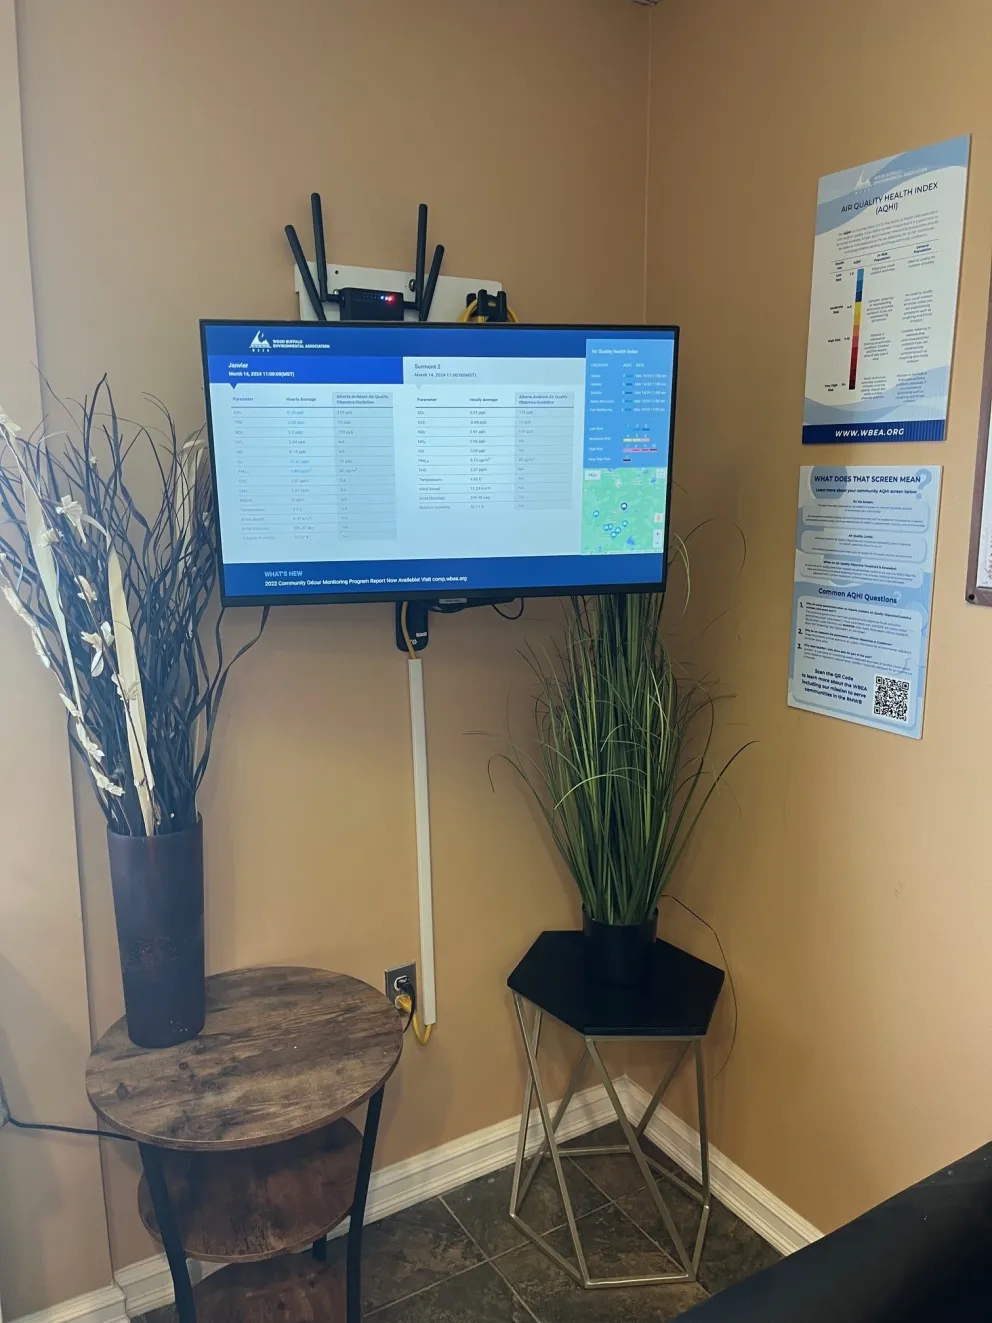
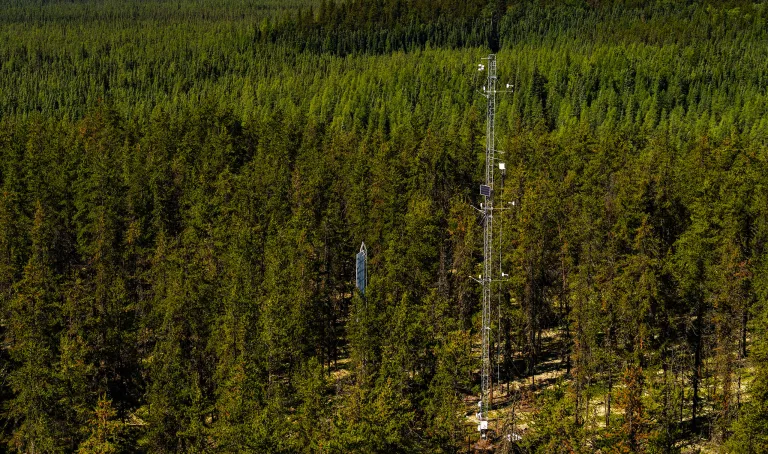
The WBEA’s Ambient Air Monitoring program collects data 24/7 from monitoring sites south of Conklin to as far north as Fort Chipewyan. Data is compared to government-set standards that define acceptable air quality for environmental and human health.
Alberta’s Air Quality Health Index—AQHI—is a scale designed to provide people with a basic measure of outdoor air quality and the associated level of health risk.
Ambient Air Monitoring
The location of the WBEA's continuous and time-integrated monitoring sites including regional meteorological towers.
Deposition Monitoring
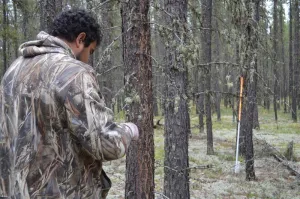
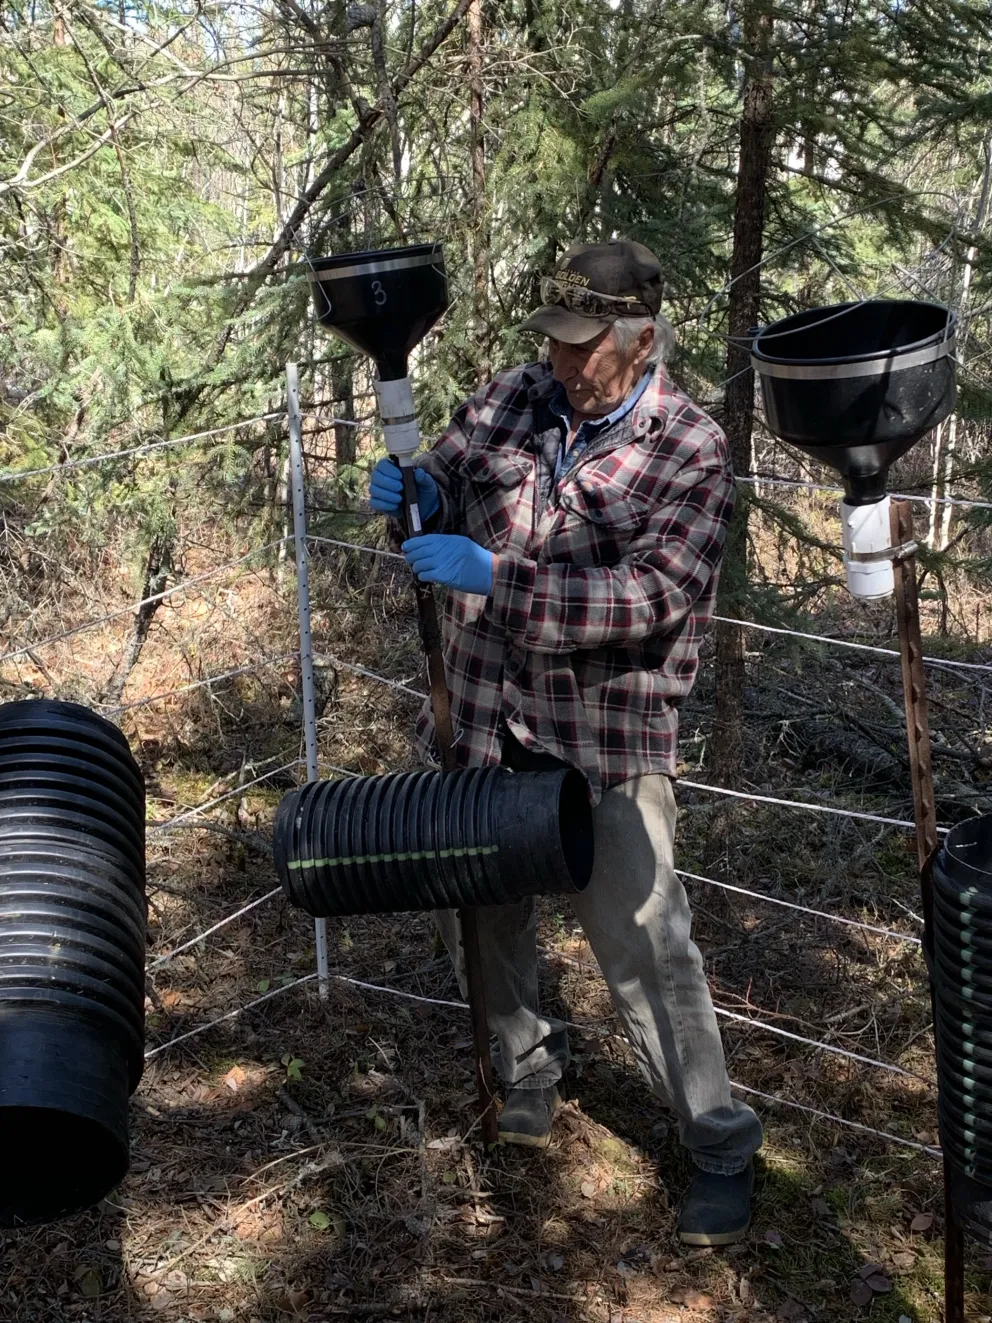
Monitoring equipment used to detect impacts of air contaminants on forest health.
2024 Hourly Annual Average
Low Risk 89.92%
Moderate Risk 4.33%
High Risk 2.79%
Very High Risk 2.96%
9
Air Pollutants
Monitored
98.09%
Air Monitoring
Network Uptime
44
Community
Members Engaged
(approximate)
34.2°C (July)
Highest Ambient
Temperature
11.1 km/h West Northwest
Average Wind Speed
& Direction
251
Sample Change-
Outs
497.5 Hours
WBEA Tech
Station Visits
-42.6°C (January)
Lowest Ambient
Temperature
2024 Hourly Annual Average
Low Risk 92.04%
Moderate Risk 4.03%
High Risk 2.16%
Very High Risk 1.77%
10
Air Pollutants
Monitored
98.71%
Air Monitoring
Network Uptime
40
Community
Members Engaged
(approximate)
35°C (July)
Highest Ambient
Temperature
6.2 km/h South
Average Wind Speed
& Direction
252
Sample Change-
Outs
517 Hours
WBEA Tech
Station Visits
-44.5°C (January)
Lowest Ambient
Temperature
2024 Hourly Annual Average
Low Risk 92.81%
Moderate Risk 3.85%
High Risk 1.35%
Very High Risk 1.98%
9
Air Pollutants
Monitored
99.18%
Air Monitoring
Network Uptime
63
Community
Members Engaged
(approximate)
34.2°C (July)
Highest Ambient
Temperature
14 km/h East
Average Wind Speed
& Direction
321
Sample Change-
Outs
69 Hours
WBEA Tech
Station Visits
-42.1°C (January)
Lowest Ambient
Temperature

2024 Hourly Annual Average
Low Risk 89.94%
Moderate Risk 5.90%
High Risk 1.92%
Very High Risk 2.24%
14
Air Pollutants
Monitored
99.00%
Air Monitoring
Network Uptime
92
Community
Members Engaged
(approximate)
35.3°C (July)
Highest Ambient
Temperature
7.4 km/h Southeast
Average Wind Speed
& Direction
251
Sample Change-
Outs
774 Hours
WBEA Tech
Station Visits
-43.1°C (January)
Lowest Ambient
Temperature
490.4 mm
Precipitation
2024 Hourly Annual Average
Low Risk 88.31%
Moderate Risk 5.51%
High Risk 2.72%
Very High Risk 3.46%
11
Air Pollutants
Monitored
99.23%
Air Monitoring
Network Uptime
350
Community
Members Engaged
(approximate)
34.4°C (July)
Highest Ambient
Temperature
9.1 km/h Southeast
Average Wind Speed
& Direction
253
Sample Change-
Outs
347.5 Hours
WBEA Tech
Station Visits
-42.6°C (January)
Lowest Ambient
Temperature
2024 Hourly Annual Average
Low Risk 90.61%
Moderate Risk 4.73%
High Risk 2.25%
Very High Risk 2.41%
11
Air Pollutants
Monitored
98.47%
Air Monitoring
Network Uptime
20
Community
Members Engaged
(approximate)
34.4°C (July)
Highest Ambient
Temperature
10.2 km/h North
Average Wind Speed
& Direction
252
Sample Change-
Outs
524.5 Hours
WBEA Tech
Station Visits
-41.9°C (January)
Lowest Ambient
Temperature
522.8 mm
Precipitation
2024 Hourly Annual Average
Low Risk 91.95%
Moderate Risk 3.38%
High Risk 2.37%
Very High Risk 2.30%
10
Air Pollutants
Monitored
99.07%
Air Monitoring
Network Uptime
50
Community
Members Engaged
(approximate)
34.4°C (July)
Highest Ambient
Temperature
5.8 km/h South Southwest
Average Wind Speed
& Direction
253
Sample Change-
Outs
402.5 Hours
WBEA Tech
Station Visits
-43.8°C (January)
Lowest Ambient
Temperature
Click onHover over the titles along the top of the table to see a description of each metric.
| Air pollutants Monitored | Air Monitoring Network Uptime | Highest Temperature (July) |
Lowest Temperature (January) |
Community Members Engaged (approximate) |
Average Wind Speed & Direction | Sample Change-Outs | WBEA Tech Station Visits | |
|---|---|---|---|---|---|---|---|---|
| Anzac | 9 | 98.09% | 34.2°C | -42.6°C | 44 | 11.1 West Northwest |
251 | 497.5 |
| Conklin | 10 | 98.71% | 35°C | -44.5°C | 40 | 6.2 South |
252 | 517 |
| Fort Chipewyan | 9 | 99.18% | 34.2°C | -42.1°C | 63 | 14 East |
321 | 69 |
| Fort McKay - Bertha Ganter | 14 | 99.00% | 35.3°C | -43.1°C | 92 | 7.4 Southeast |
251 | 774 |
| Fort McMurray - Athabasca Valley |
11 | 99.23% | 34.4°C | -42.6°C | 350 | 9.1 Southeast |
253 | 347.5 |
| Fort McMurray - Patricia McInnes |
11 | 98.47% | 34.4°C | -41.9°C | 20 | 10.2 North |
252 | 524.5 |
| Janvier | 10 | 99.07% | 34.4°C | -43.8°C | 50 | 5.8 South Southwest |
253 | 402.5 |
2024 Hourly Annual Average
Anzac
Low Risk 89.92%
Moderate Risk 4.33%
High Risk 2.79%
Very High Risk 2.96%
Conklin
Low Risk 92.04%
Moderate Risk 4.03%
High Risk 2.16%
Very High Risk 1.77%
Fort Chipewyan
Low Risk 92.81%
Moderate Risk 3.85%
High Risk 1.35%
Very High Risk 1.98%
Fort McKay - Bertha Ganter
Low Risk 89.94%
Moderate Risk 5.90%
High Risk 1.92%
Very High Risk 2.24%
Fort McMurray - Athabasca Valley
Low Risk 88.31%
Moderate Risk 5.51%
High Risk 2.72%
Very High Risk 3.46%
Fort McMurray - Patricia McInnes
Low Risk 90.61%
Moderate Risk 4.73%
High Risk 2.25%
Very High Risk 2.41%
Janvier
Low Risk 91.95%
Moderate Risk 3.38%
High Risk 2.37%
Very High Risk 2.30%
The WBEA operated approximately 30 ambient air monitoring stations (AMS) throughout the RMWB in 2024. These included industrial, attribution, community, background, and meteorological stations.
The Ambient Air Monitoring (AAM) Program functions to address multiple objectives, scientific questions, and requirements set by global, national, provincial, and regional jurisdictions. The WBEA’s website highlights each of these requirements specifically and how they relate to the WBEA’s monitoring network activities.
When ambient concentrations of any air pollutant the WBEA measures exceed the Alberta Ambient Air Quality Objectives and Guidelines (AAAQOs & AAAQGs), which are set provincially, the WBEA has an Immediate Reporting Protocol that is put into action.
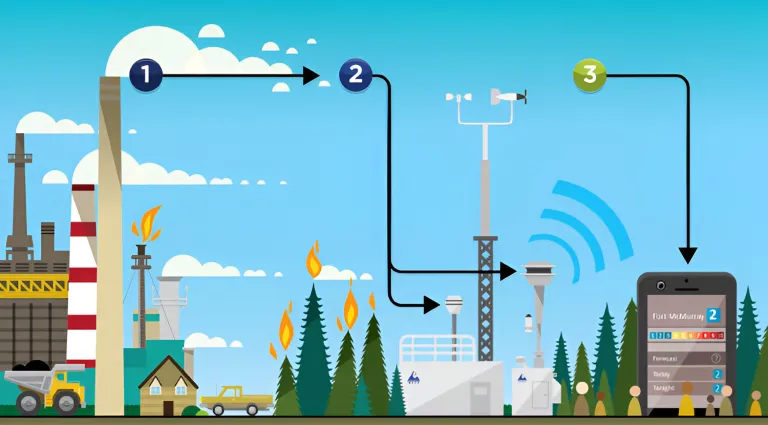
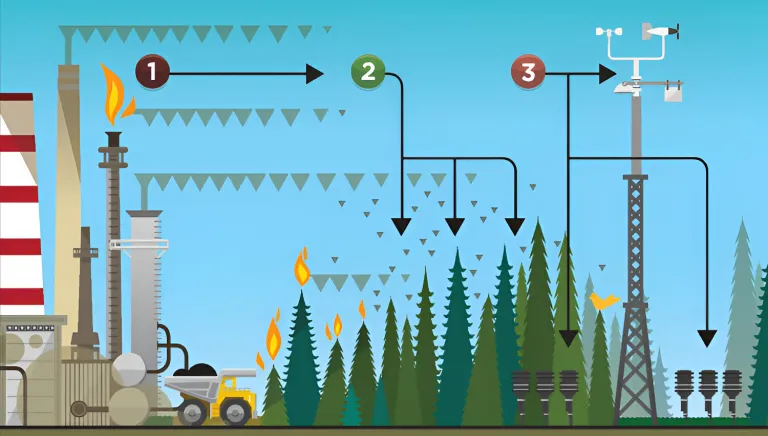
Pollution is emitted into the air from a variety of sources.
The WBEA ambient air monitoring stations measure the concentrations of pollutants in the air.
The information the WBEA collects is available to view and is used to calculate the Air Quality Health Index (AQHI).
The WBEA’s ambient air quality data is compared to several established air quality thresholds, triggers, and limits. Air Quality Events represent a deviation from standards set as the Alberta Ambient Air Quality Objectives (AAAQO), and indicators identified as the Alberta Ambient Air Quality Guidelines (AAAQG). When an exceedance occurs, the WBEA follows the guidance of the Air Monitoring Directive and reports each occurrence to the appropriate governing bodies.
The WBEA developed an Air Quality Events (AQE) app as another way to notify interested stakeholders and partners of air quality events related to AAAQOs and AAAQGs. The AQE app provides near-real time notifications when an exceedance occurs in the network and allows users to subscribe to air monitoring stations of interest. The app is available for download on iOS devices. In addition, all the historical and near real-time air quality events information are stored on the Air Quality Events page of the WBEA website.

The first graph below shows the exceedances in 2024 based on station locations.The second graph presents a total count of air quality event exceedances at all WBEA ambient air monitoring stations over a five-year period for AAAQOs from 2019-2024.
Note: Values may be too small to be visible on some graphs. Hover over the graph to view specific values.
Note: Forest fire season was from March 1 – October 31, 2024
Note: Forest fire season was from March 1 – October 31, 2024
Note: TSP data reporting began in September 2022. Dustfall data reporting began in November 2022.
Note: In 2024, the WBEA reported PM2.5 AAAQO and AAAQG exceedances following the Temporary Airshed Wildfire Bulk Reporting Protocol (in effect from April 1 to October 31). Under this protocol only 24-hour AAAQO exceedance reporting was required; 1-hour PM2.5 exceedances were not, and are excluded in the data above.
The Lower Athabasca Regional Plan (LARP) is a strategy developed by the Government of Alberta under the Land-use Framework in 2012. It outlines regional outcomes that reflect what the government aims to achieve and carries legislative authority under the Alberta Land Stewardship Act.
The LARP air quality objective—also known as the Air Quality Management Framework (AQMF)—is designed to manage emissions released from multiple sources to ensure they do not collectively result in unacceptable air quality. The AQMF for our region establishes trigger levels and limits for nitrogen dioxide (NO2) and sulfur dioxide (SO2), as outlined in the table below. It also defines air quality levels to help guide management decisions. The WBEA provides air quality data to Alberta Environment and Protected Areas (AEPA), which is used to determine the appropriate level of management response.
The following graphs display the annual average and hourly 99th percentile concentrations of NO2 and SO2 at each monitoring station, compared against the corresponding triggers and limits for each parameter. The 99th percentile hourly data is a statistical measure used to represent the upper range of observed concentrations. Increases in this measure beyond LARP trigger levels can serve as an early warning, prompting proactive management actions to prevent future exceedances.
Learn more about LARPMeteorological parameters, including wind speed and direction, humidity, precipitation, atmospheric pressure, solar radiation, and the vertical temperature structure of the atmosphere, all impact the dispersion, deposition, and transformation of common air pollutants.
Wind rose plots provide visual context for the speed, direction, and frequency of winds, and are shown below for each WBEA community station in the network. The colours within each wind rose triangle denote the frequency of the wind speed (shown in the legend above the wind roses). Calms are shown for each station as a percentage of time that wind speeds are below 0.5 kilometers per hour (km/h).
An example of how to read a wind rose plot: the largest triangle in Fort Chipewyan wind rose shows the wind comes from the East, about 16% of the time in 2024. The olive-green colour in this triangle shows the wind was between 10 and 15 km/h about 4.5% of the time. Wind speeds were less than 0.5 km/h in Fort Chipewyan 0.00% of the time (calms).
Wind Speed (km/h)
Calms: 0.00%
Tower Height: 20m
0.5 - 5
5 - 10
10 - 15
15 - 20
20 - 25
>= 25
Wind Speed (km/h)
Calms: 0.00%
Tower Height: 20m
0.5 - 5
5 - 10
10 - 15
15 - 20
20 - 25
>= 25
Wind Speed (km/h)
Calms: 0.00%
Tower Height: 20m
0.5 - 5
5 - 10
10 - 15
15 - 20
20 - 25
>= 25
Wind Speed (km/h)
Calms: 0.00%
Tower Height: 20m
0.5 - 5
5 - 10
10 - 15
15 - 20
20 - 25
>= 25
Wind Speed (km/h)
Calms: 0.00%
Tower Height: 20m
0.5 - 5
5 - 10
10 - 15
15 - 20
20 - 25
>= 25
Wind Speed (km/h)
Calms: 0.00%
Tower Height: 20m
0.5 - 5
5 - 10
10 - 15
15 - 20
20 - 25
>= 25
Wind Speed (km/h)
Calms: 0.00%
Tower Height: 20m
0.5 - 5
5 - 10
10 - 15
15 - 20
20 - 25
>= 25
Wind Speed (km/h)
Calms: 0.00%
Tower Height: 20m
0.5 - 5
5 - 10
10 - 15
15 - 20
20 - 25
>= 25
As its title suggests, the WBEA’s continuous ambient air monitoring uses analyzers that continually measure concentrations of pollutants in the air. This data is readily available to anyone in near real-time on our website, wbea.org.
In addition to specific compounds, all stations continuously measure temperature, relative humidity, and wind speed and direction.
The data for continuous monitoring is presented in the following graphs as the annual hourly average (mean) concentrations of each parameter, along with the annual hourly 99th percentile and maximum concentrations. The annual hourly 99th percentile is used to show the high end of concentrations measured at the WBEA air monitoring stations, after removing the highest 1% of events which may be outliers.
Note: Averages may be too small to be visible on some graphs. Hover over the graph to view specific values.
* Note: The WBEA began operating new continuous ambient air monitoring sites in 2024. Hangingstone Expansion began reporting data in July, while Monday Creek began reporting data in November.
** Note: The WBEA uses Portable Air Monitoring Stations to measure air quality in locations where a permanent air monitoring station does not exist. Based on regulatory requirements, ambient air quality monitoring may be required for 3, 6, or 12 months per year.
Sulphur dioxide (SO2) – SO2 is produced from the combustion of sulphur-containing fossil fuels. Sulphur dioxide in the air at high concentrations can make breathing difficult, particularly for children, the elderly, and people with asthma. SO2 reacts in the atmosphere to form sulphuric acid and acidic aerosols, which contribute to acid deposition and acid rain.
Time-integrated sampling provides more detailed examination of species present in ambient air, and supplements continuous monitoring which reports a total concentration in real time. Time-integrated monitoring methods consist of exposing sample media to the atmosphere for a period, then collecting and sending that media to a laboratory for analysis.
The WBEA's time-integrated sampling data is available at https://wbea.org/data/time-integrated-data-search/. The 2024 data for time-integrated monitoring methods is presented in the graphs below as the annual average (mean) of 24-hour sample concentrations, along with the 95th percentile to show readings on the high-end of the data collected, after removing the highest 5% which may be outliers. There are numerous species collected, however, the graphs show the nine (9) or ten (10) parameters with the highest concentrations in 2024.
Note: Select which parameter you would like to view, and then use the drop-down menu to select an air monitoring station.
Note: Averages may be too small to be visible on some graphs. Hover over the graph to view specific values.
Note: Forest fire season was considered to be from March 1 – October 31, 2024.
Particulate matter less than 2.5 µm - Ions - Particulate matter consists of a mixture of solid particles and aerosols found in the air. PM2.5 is the fraction of total particulate that are 2.5 μm (microns) in diameter or less, and is produced mainly by combustion processes, including forest fires.
Typically, exceedances of the PM2.5 AAAQO in the WBEA network are a result of forest fires. Fine particles are composed primarily of sulphate, nitrate, ammonium, inorganic and organic carbon compounds, and heavy metals. PM2.5 poses a health risk as the particles can be inhaled deep into the lungs.
The continuous analyzer measures the concentration of particulate matter in the air at any given time. A time-integrated PM2.5 sample is a measure of dry deposition and is analyzed for major ions similar to the wet deposition samples, and metals that make up the particulate matter in the air.
Also referred to as the Terrestrial Environmental Effects Monitoring (TEEM) Program, this initiative was established in response to concerns from communities, industry, and government about the impacts of industrial development on regional forests. Its primary objective is to identify cause-effect relationships between air pollutants and forest ecosystem health in the region.
To achieve this, the WBEA operates two complementary programs: a long-term Forest Health Monitoring (FHM) Program and an Atmospheric Pollutant Deposition Monitoring Program. Together, these programs monitor air pollution and deposition (the stressors), as well as their potential impacts on jack pine forest ecosystems (the effects).
Integrated analysis of data from both programs is essential. Key areas of focus include regional and temporal changes in deposition and their effects on jack pine forests. The WBEA emphasizes accessible data, information sharing, and continuous adaptation to meet the evolving needs of its members.
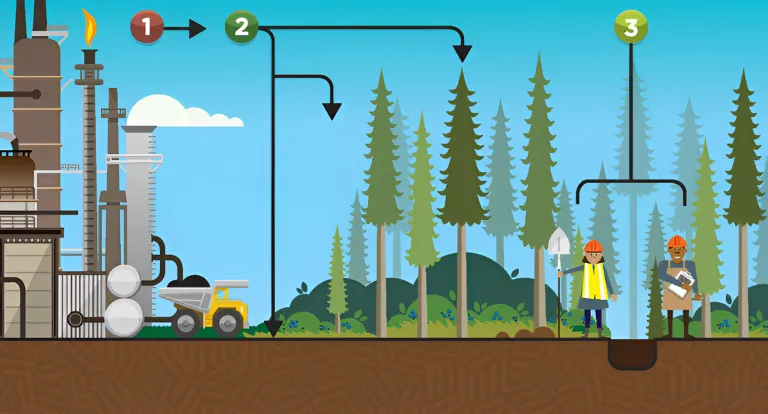
Pollution is emitted into the air from a variety of sources.
The pollution may be deposited onto the surrounding environment.
The WBEA collects samples to measure the amount of pollution deposited into the enviroment.
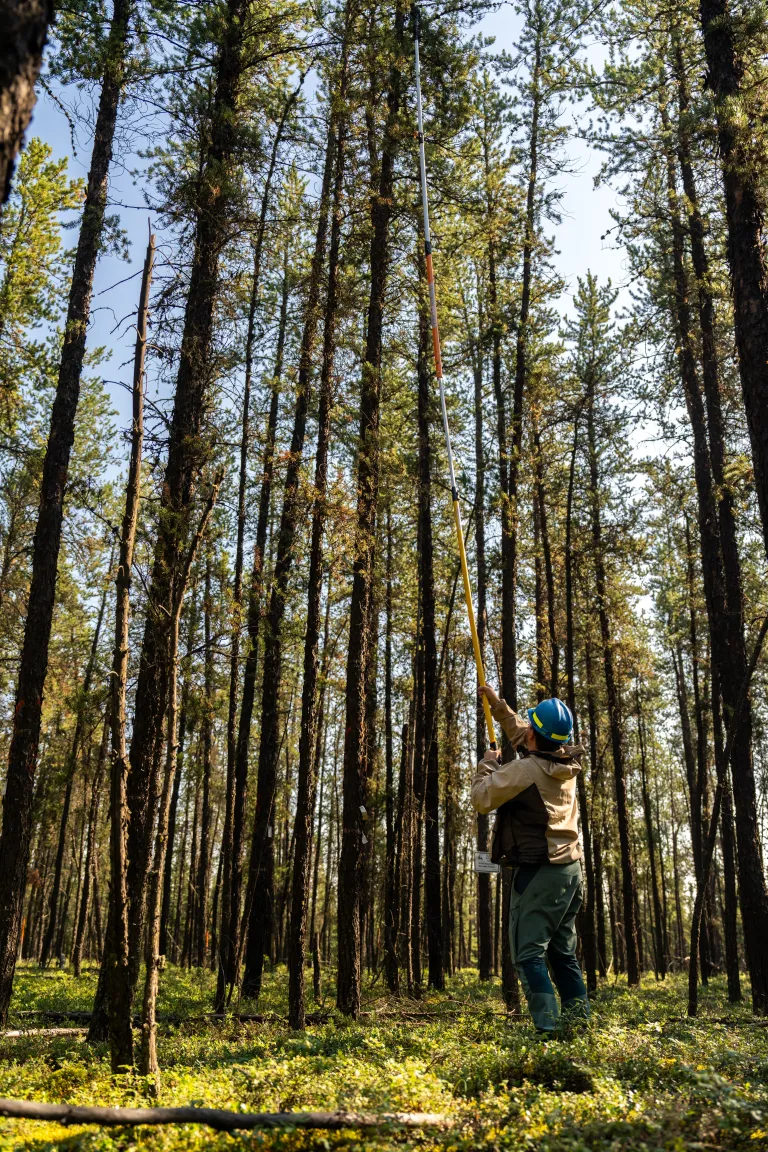
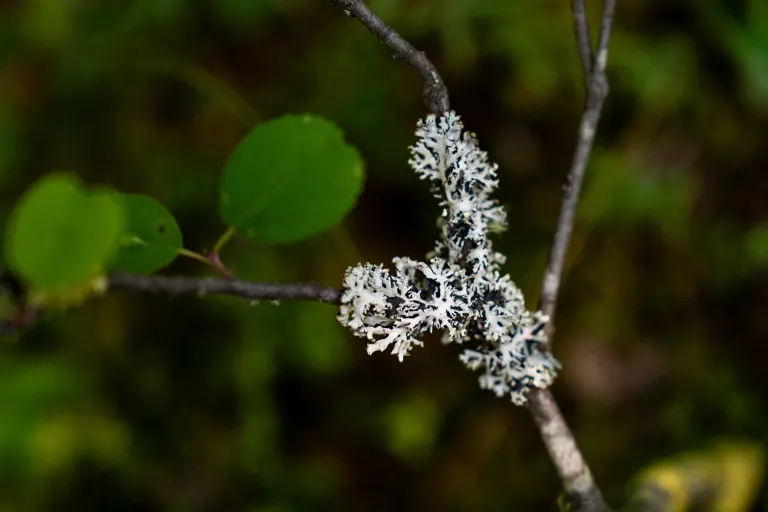
The Forest Health Monitoring (FHM) Program is an intensive sampling campaign conducted every 6 years. These campaigns aim to understand the impact deposition has on the forest through sampling of soil, vegetation, and lichen.
The program began in the early 1990’s and upload jack pine (Pinus banksania) ecosystem was selected for monitoring due to its sensitivity to acidification. In these ecosystems, the effects of acid deposition are expected to follow a cascading patter – beginning at the soil level and progressing through changes to vegetation, the tree stand and eventually the broader landscape. While larger-scale impacts may take longer to emerge, they are also more difficult to reverse.
In 2024, the WBEA conducted the FHM program’s fifth intensive campaign, following previous campaigns in 1998, 2004, 2011-2013, and 2018. Data collected contributes to a robust long-term dataset and analyses of this data is ongoing.
In 2023, the WBEA began a Forest Health Workshop series with the goal of providing a platform for information sharing and collaborative discussions on monitoring procedures and program direction. The workshops continued into 2024 with one important outcome of these workshops being the addition of two focus studies to the 2024 monitoring:
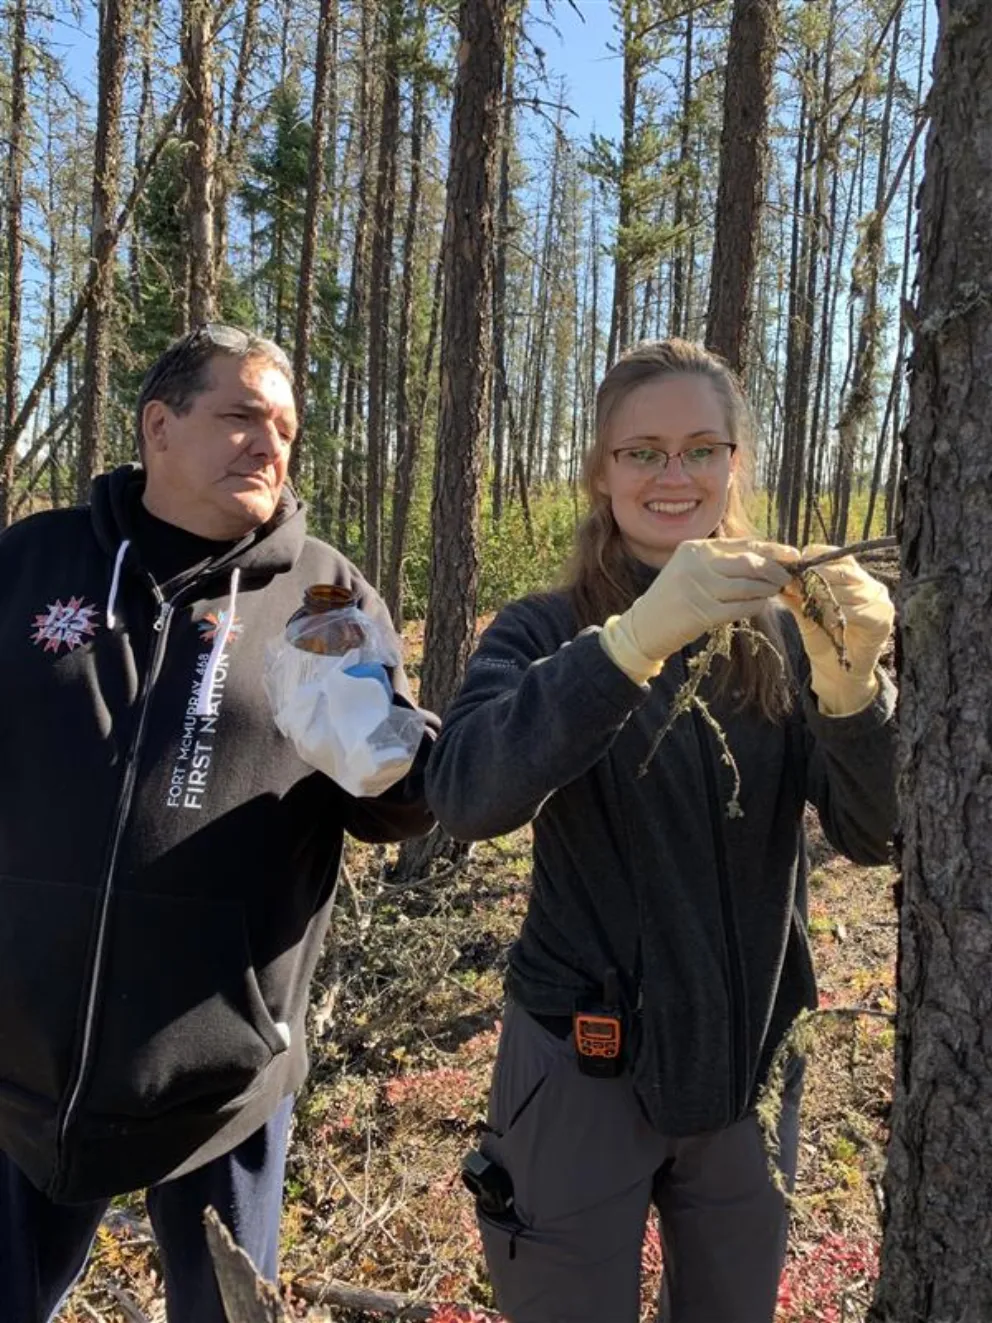
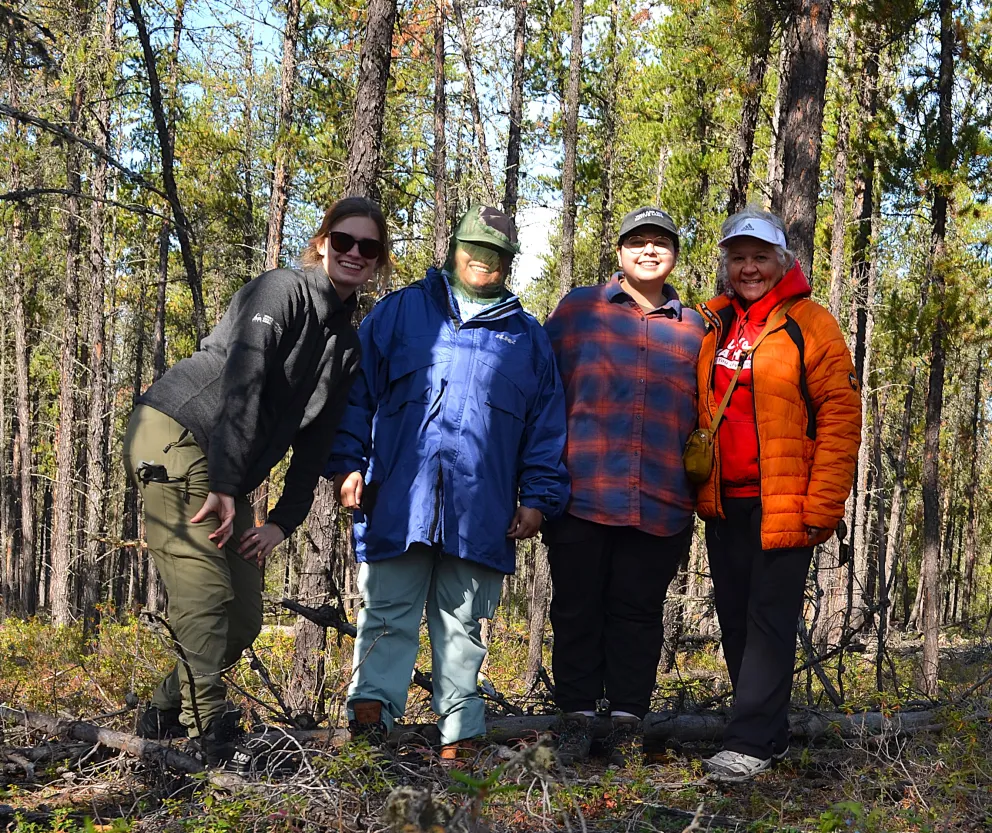
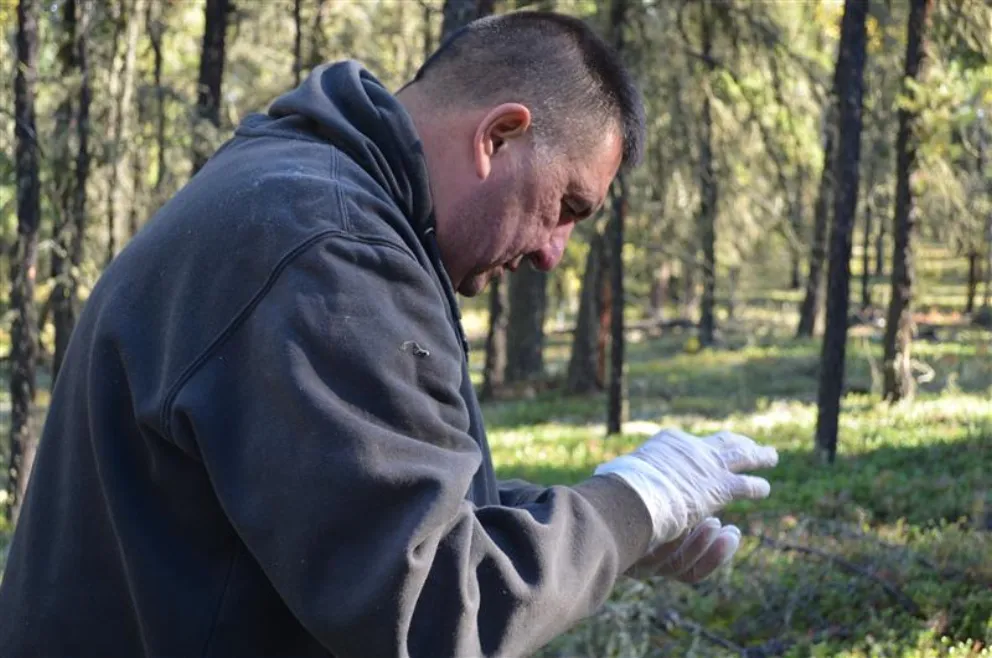
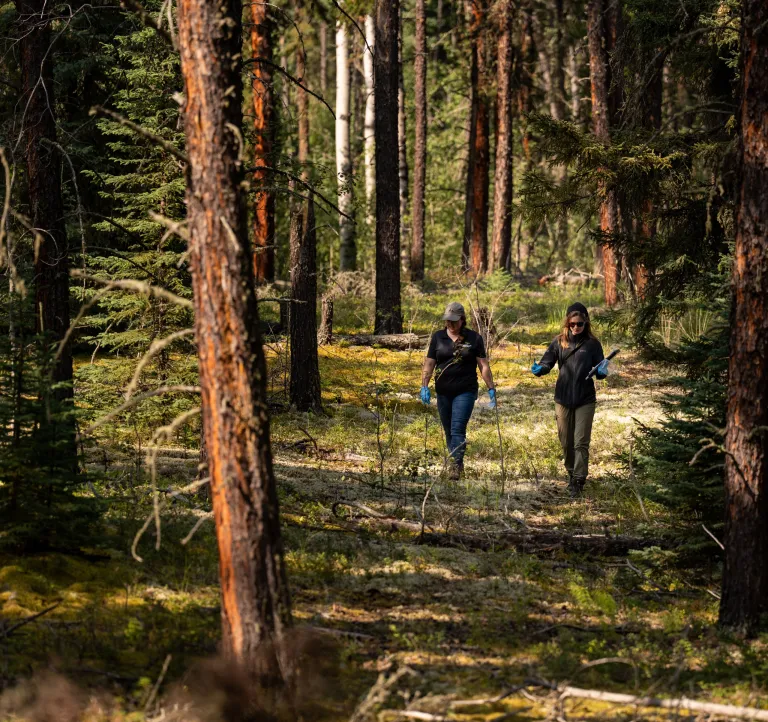
Fieldwork involved members from nine local Indigenous communities, reinforcing the program’s commitment to inclusive and collaborative monitoring. Samples of both blueberries and lichen were collected for laboratory analyses and ecological observations were recorded.
Pollution is emitted into the air from a variety of sources.
The pollution travels in the air and may be deposited onto the surrounding forest.
The WBEA collects data about trees, plants, lichen, and soil to understand if & how the pollution is affecting the forest.
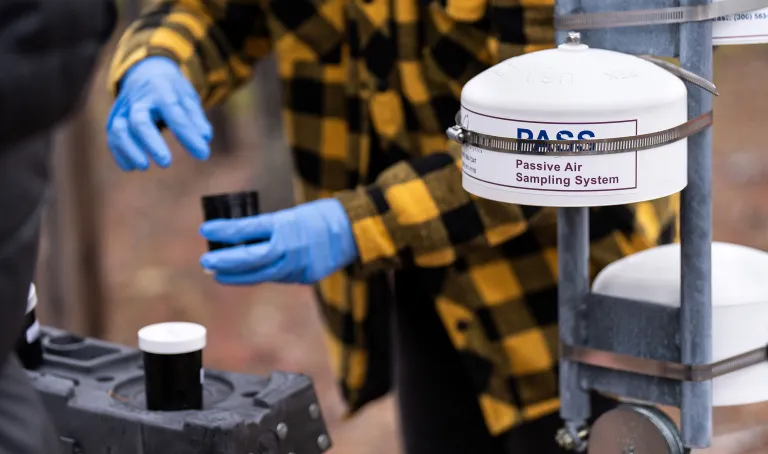
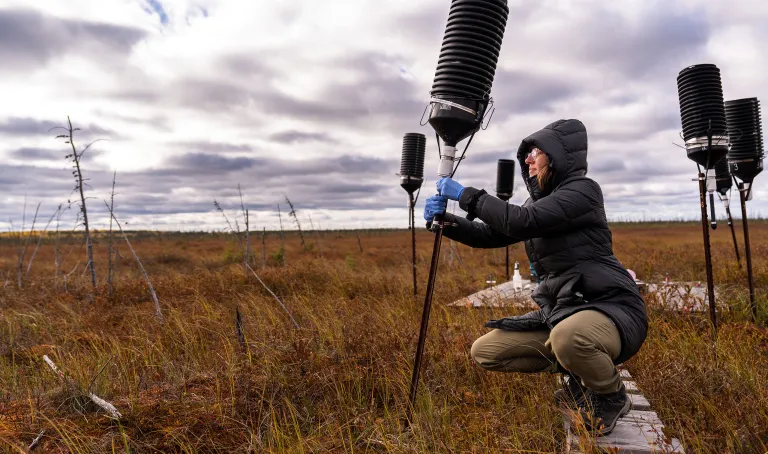
The Deposition Monitoring program uses three primary methods to monitor pollutant deposition: passive samplers, denuders, and ion exchange resins (IERs). Combined with meteorological data, these tools help determine where and when atmospheric deposition occurs.
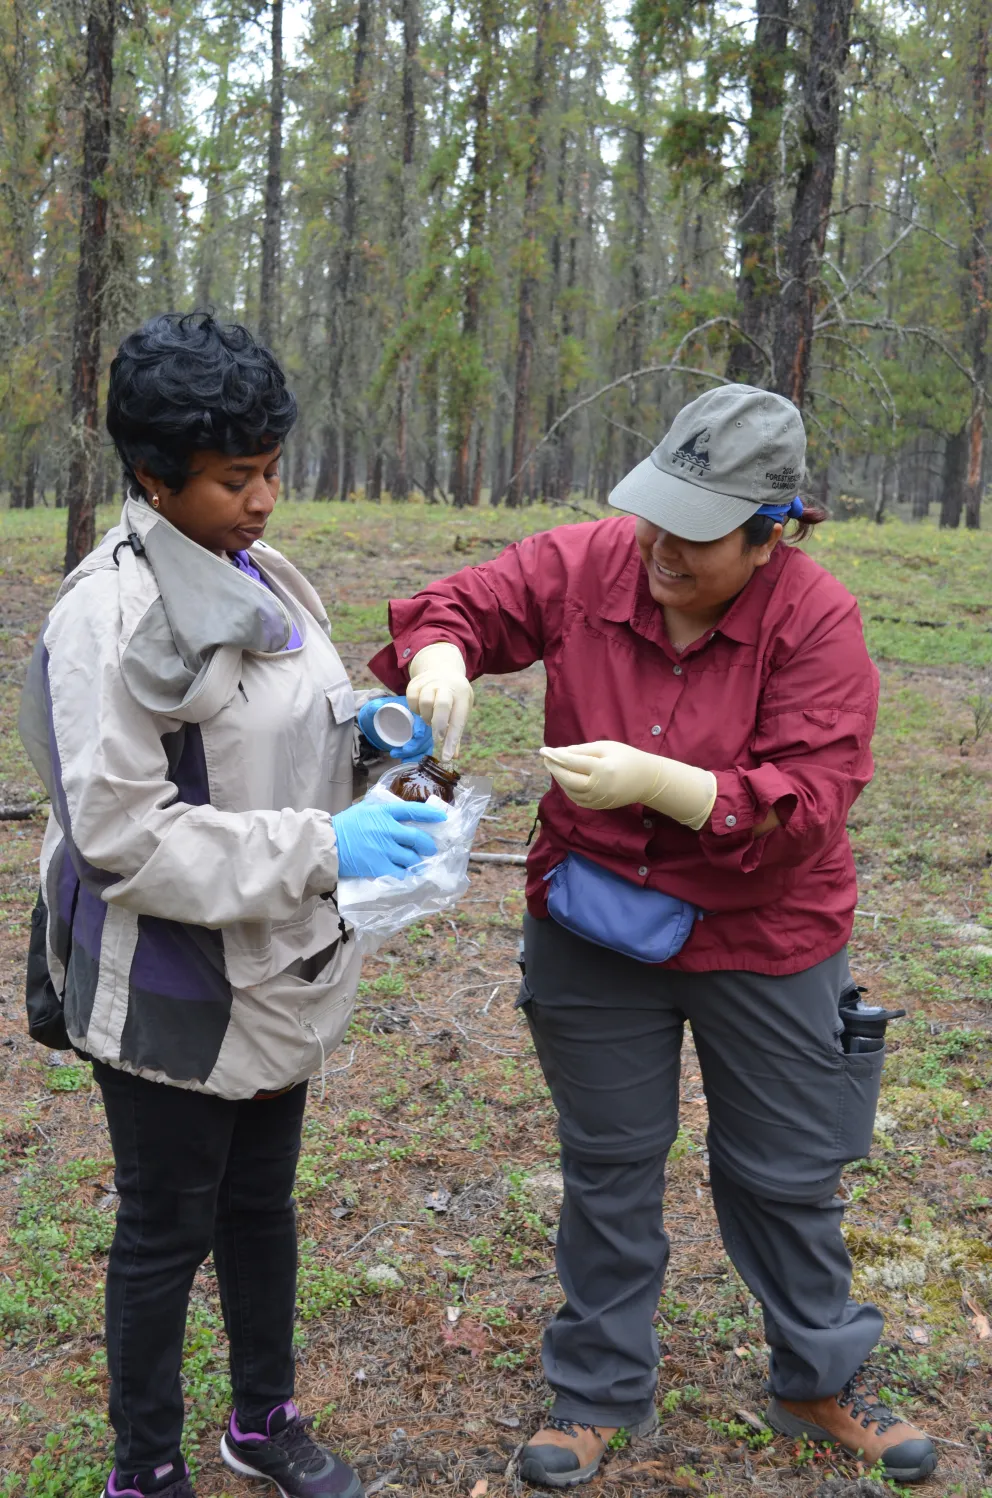
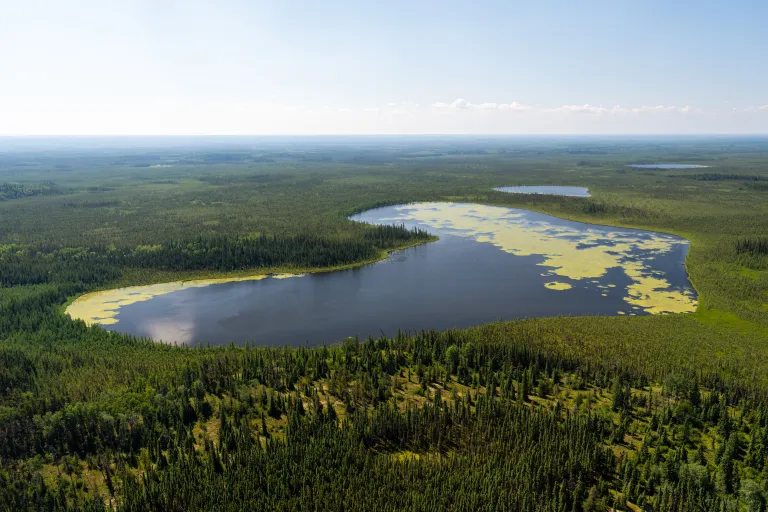
Passive air samplers are a cost-effective method for monitoring across wide and remote areas. They operate without power or moving parts and are used to support regional deposition modeling. In 2024, the passive sampling network was expanded north into the Peace-Athabasca Delta and Fort Chipewyan—representing the furthest north deposition monitoring by the WBEA to date.
Denuders are active air samplers that draw a known volume of air through sample media or continuous analyzers using a pump. Denuders are mainly located on towers to sample air above the jack pine canopy. In 2024, this program also expanded into the Peace-Athabasca Delta and Fort Chipewyan, the furthest north the WBEA has conducted deposition monitoring.
IERs are passive devices containing resin beads that capture anions (e.g., ionic nitrogen and sulphur) and base cations from precipitation. In 2024, the WBEA added four new IER sites: two to the north, in partnership with the Athabasca Chipewyan First Nation and Mikisew Cree First Nation, and two to the northwest in partnership with McMurray Métis.
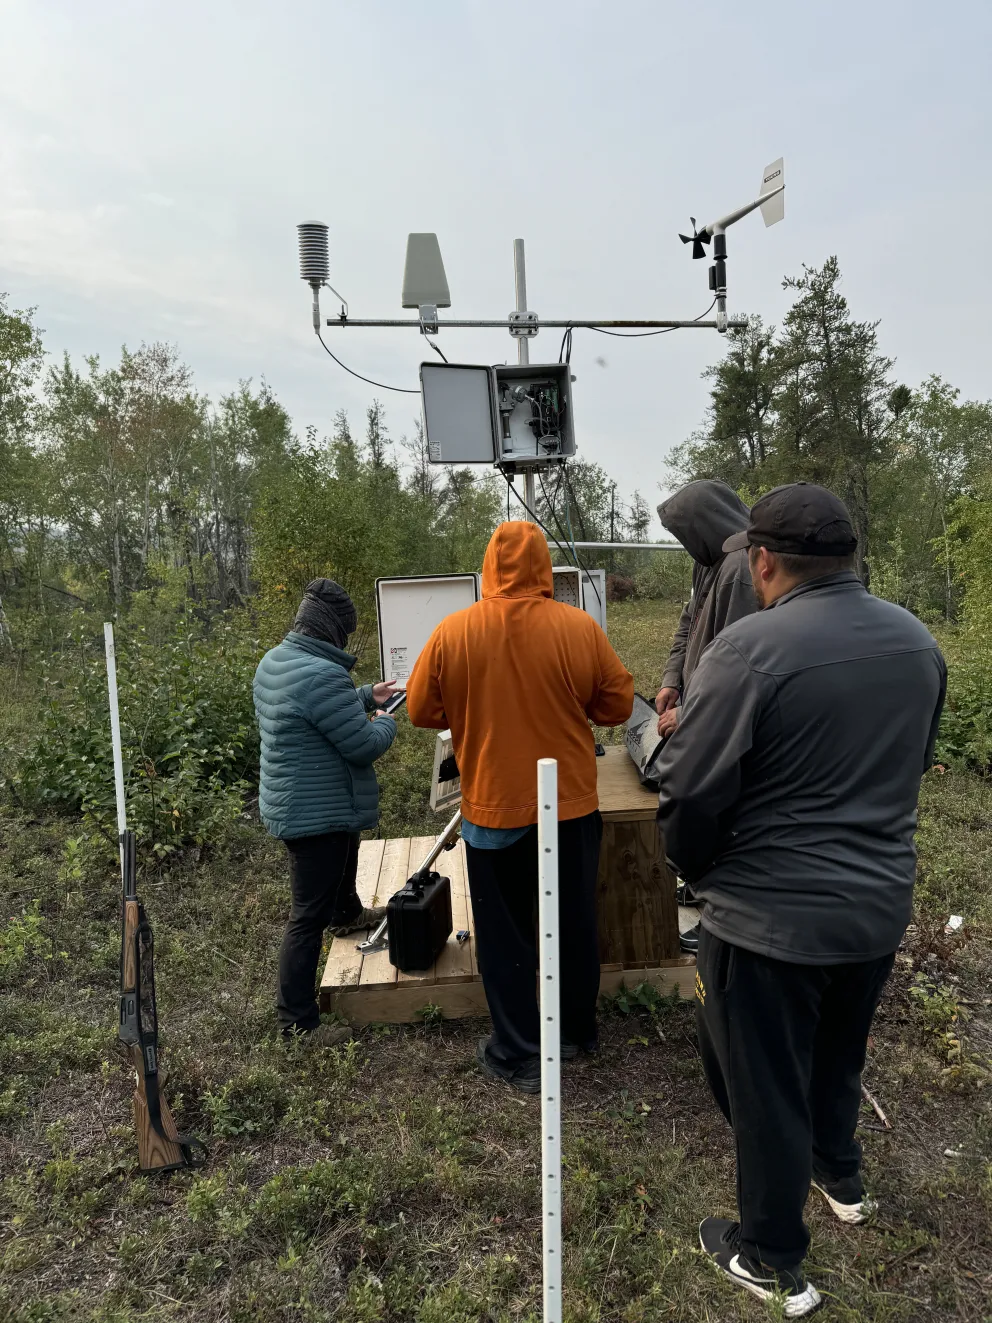
The WBEA's regional meteorological network provides key data for calculating deposition rates, modelling dry deposition, and evaluating the performance of deterministic models. The network is comprised of six 30-meter instrumented towers ("met towers") that provide continuous, hourly data on climatic conditions throughout the Wood Buffalo region. Each met tower is co-located with a Forest Health Monitoring (FHM) site and monitors air temperature, relative humidity, wind speed, wind direction, and solar radiation at four levels within and above the jack pine canopy, as well as temperature and volumetric water content within forest soil.
The map belowadjacent map shows where each of the six 30-meter meteorological towers are located within the WBEA's network. The wind data collected from these towers, measured above the tree canopy, are used to characterize wind flow in a wider geographical area, calculate emission deposition, and evaluate ecological data. The corresponding wind roses for each tower are located below.
0.5 - 5
5 - 10
10 - 15
15 - 20
20 - 25
>= 25
Average yearly data is displayed by default. Select the left or right arrows to view seasonal data.

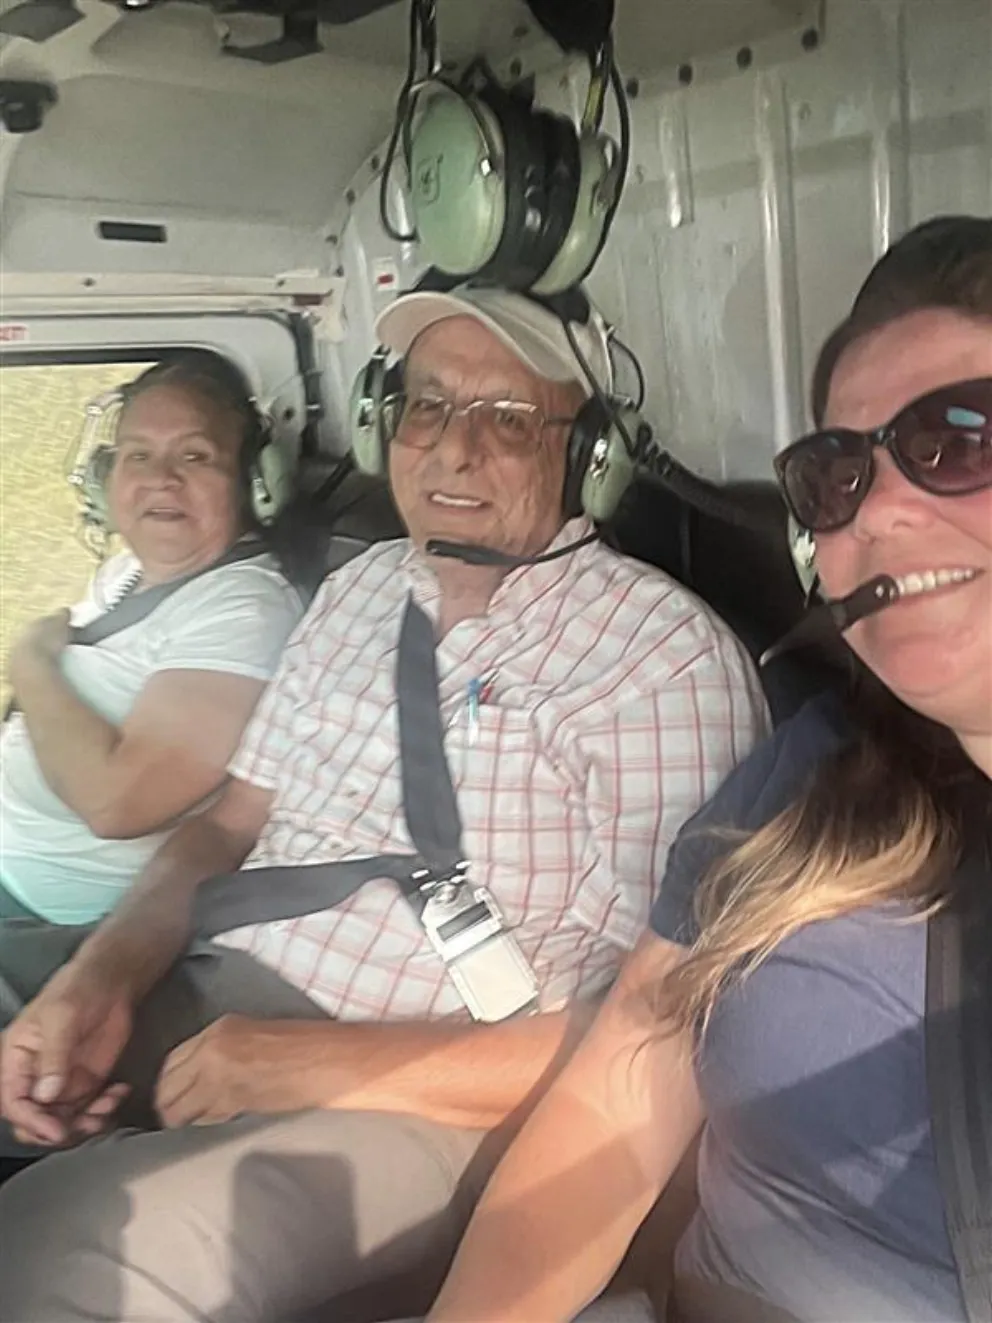
Collaboration with Indigenous communities in the Wood Buffalo region continues to be a core focus of the WBEA. A key development for the re-engaged Traditional Indigenous Knowledge Committee (TIKC) in 2024 was to establish a Terms of Reference reflective of the Committee's new purpose: to guide the WBEA's monitoring programs in ways that reflect Indigenous perspectives and are inclusive of community concerns, values, and priorities.
Elder James Woodward of Fort McMurray 468 First Nation was elected as the Chair of the TIKC, with Elder Lorraine Albert of Mikisew Cree First Nation serving as the alternate Chair. The committee's efforts, whether conducted in the boardroom or on the ground, focused on creating pathways to integrate Traditional Indigenous Knowledge and Land User Knowledge into WBEA’s Ambient Air and Deposition Monitoring Programs.
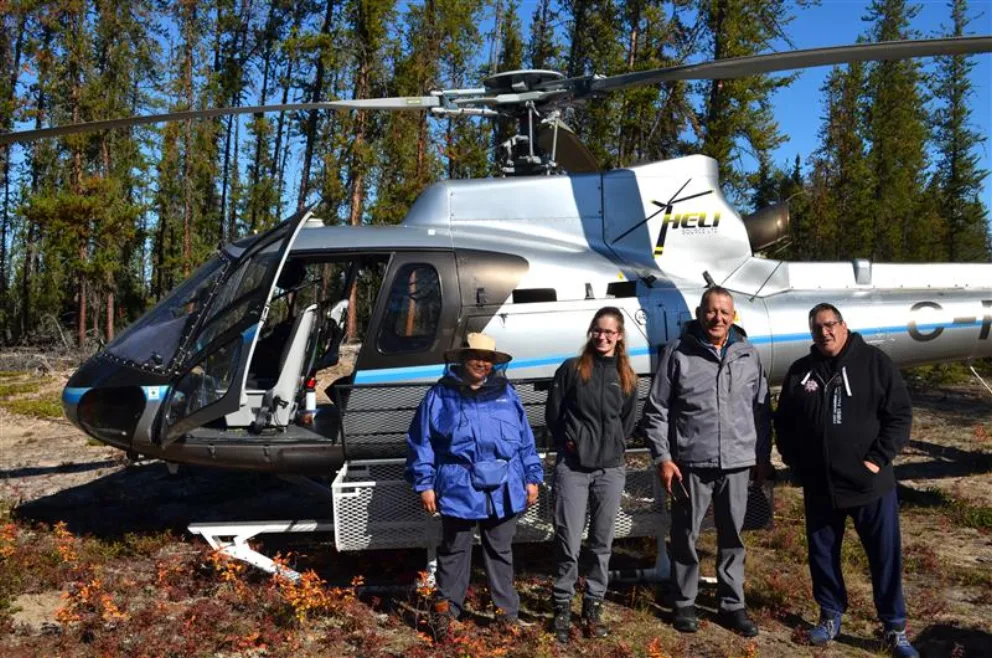
Indigenous community members played an active role in the collection of passive, denuder, and ion-exchange resin samples at various deposition sites across the region. Additionally, the WBEA hosted a series of Forest Health Monitoring (FHM) workshops with members, where both current monitoring and the future direction of the program were discussed. Members from 11 Indigenous communities across the region brought unique perspectives to the workshop series.
The workshops resulted in two focused studies:
Both studies were incorporated into the 2024 FHM sampling campaign. Members from nine Indigenous communities participated in the sample collection.
During the 2024 FHM workshops, there was strong support for the inclusion of Indigenous perspectives and ecological observations at FHM sites. To address this, ecological observations were recorded at each site, providing a more comprehensive understanding of environmental conditions, and incorporating both scientific and Indigenous viewpoints.

The Community-Led Berry Contamination Study is a multi-year, community-based monitoring initiative that builds upon work initiated by Fort McKay First Nation in 2010, with support from the WBEA. In 2024, a shift in process occurred, as the WBEA transitioned to a support role, with communities submitting projects to the Oilsands Monitoring (OSM) program individually. This change was made to allow communities and OSM staff to collaborate more directly, ensuring that the needs and priorities of the communities drive the study.
The WBEA will continue to support the participating communities in the Berry Contamination Study as they identify their ongoing needs and projects.
The WBEA was fortunate to work with many organizations in 2024. Each partner organization is key in supporting the WBEA’s vision, mission, and values. The tabs below expand to highlight ongoing WBEA partnerships.
Athabasca Chipewyan First Nation
Chipewyan Prairie Dene First Nation
Christina River Dene Nation Council
Fort McMurray 468 First Nation
Alberta Environment and Protected Areas
The WBEA is a member of the Alberta Airsheds Council (AAC), which is a partnership of Alberta’s Airsheds and provides leadership in support of healthy air quality for Albertans and the environment.
The AAC provides a forum for Airsheds to work and learn together, to continue to advance effective and efficient air monitoring, reporting and outreach, and to address regional matters. Click the link below to visit the AAC website.
Learn More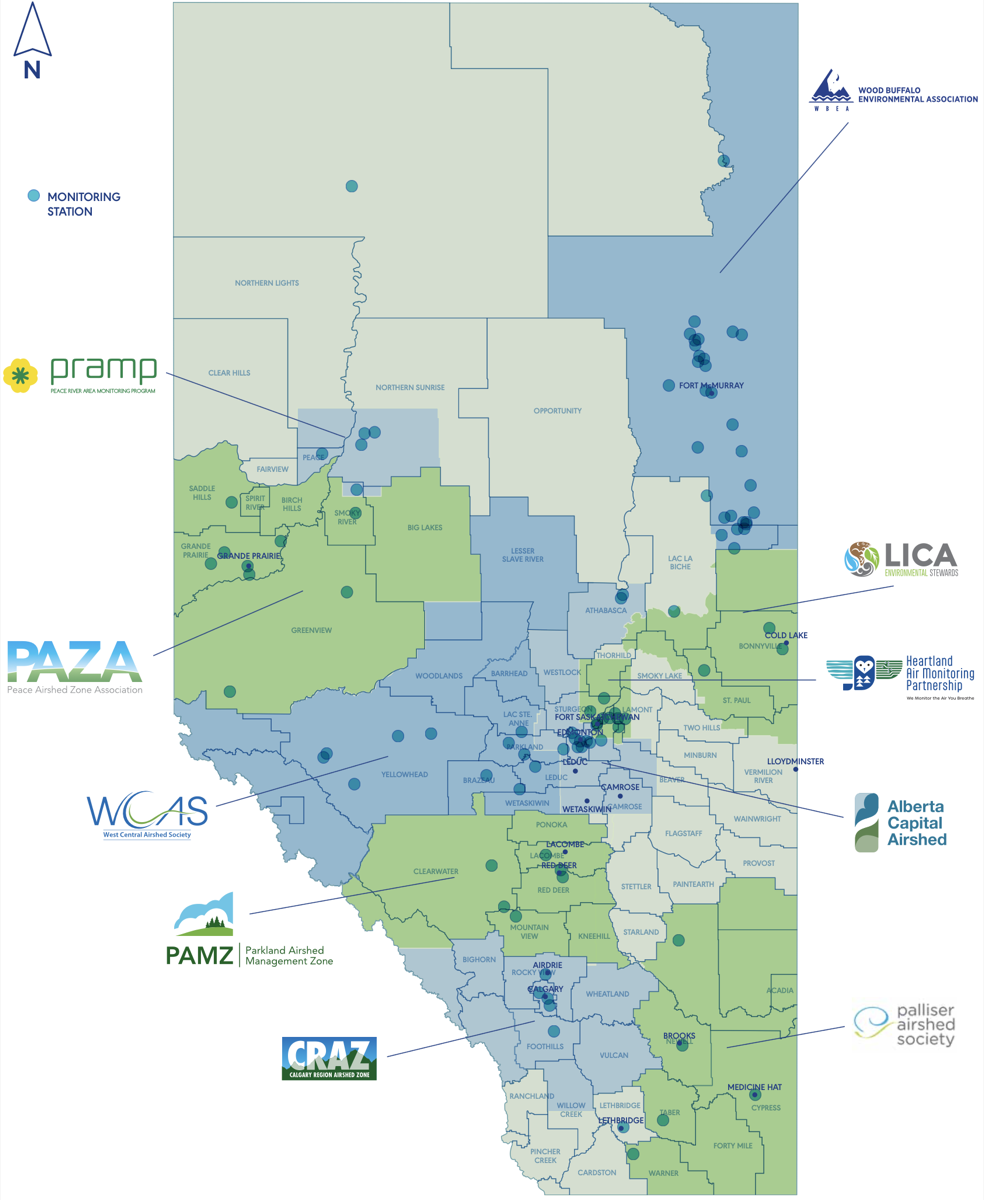
The WBEA appreciates working with its partners at AEPA to ensure air quality monitoring is delivered in the Athabasca Oil Sands Region. The WBEA acknowledges the financial support of the AEPA and the Oil Sands Monitoring (OSM) Program. The work included in this report was partially funded under the OSM Program and is independent of any position of the OSM Program.
Alberta Environments and Protected Areas Oil Sands Monitoring Program